Transparency and project health
Here is a list of Transparency and project health features:
- Track your progress using reports
- Reports are configurable by the process
- Exporting reports
- The data warehouse
- Build reports
- Work item reports
- Source control reports
- Repository and data warehouse reports
- Project health and team information at a glance
- Highly customizable
- Mini Dashboard
- Personal Dashboards
- Wiget Catalog
- See what others are working on
- Progressive Disclosure and drill-in
Track your progress using reports
The Team Reports component allows you to track various aspects of your project’s progress using reports. These reports are available both in the rich client and in the web UI. Rational Team Concert ships with a library of predefined reports that will allow you to get going with reporting right away.To view a report in the Eclipse-based IDE client, expand the project area in the Team Artifacts view. Expand Reports > Shared Reports, and double-click to open a report from within one of the folders.
To view a report in the web UI, select the Reports menu in the top navigation area, select “Shared Reports”, and then select a report.

Reports are configurable by the process
Reports are configurable so that they reflect the process that your development team uses. Although Rational Team Concert contains a library of more than fifty pre-defined report templates, these are not all necessarily applicable to every way of working. In recognition of this fact, a list of reports may be specified in a process template so that all project areas created from this template will automatically contain the selected reports.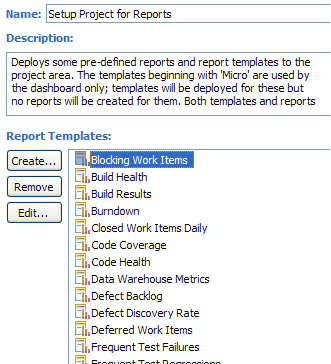
Exporting reports
While HTML is often a convenient way to view reports, many users will have requirements to view reports in alternative formats. The Team Reports component supports exporting any report to a variety of formats. The current list of supported formats includes PDF, PostScript, Excel, Word and PowerPoint. To export a report, first view it in the report viewer (either in the Eclipse-based IDE client or in the web UI). Select the Export toolbar action and specify an output format to save the file to disk.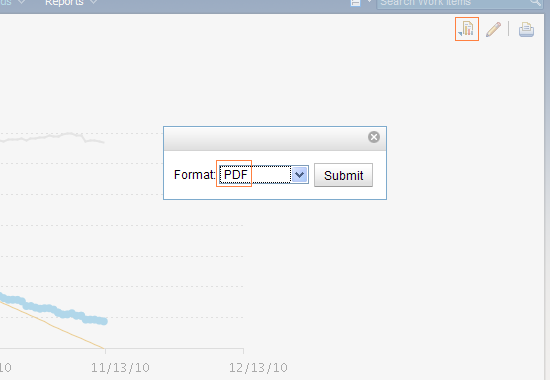
The data warehouse
A data warehouse is a special database designed to store aggregated, historical data. This data can then be easily queried and used to discover trends and justify changes (or non-changes) based on those trends. The Reports component implements a data warehouse on the Jazz Team Server, which is populated daily with a plethora of data about many different artifact types, including work items, streams, and builds. In fact, many of the out-of-the-box reports included with Rational Team Concert use this data to provide historical trend charts (compare these charts with those that plot only the current state of the repository).The data warehouse requires no configuration out of the box, and will automatically begin collecting data for the reports to present.
Build reports
The build is a central feature of many development teams, and a close eye is kept on it. When the build fails, people need to know why it failed and how to fix it. Over time, interested stakeholders would also like to know about the build’s record. How often does it fail? How long does it take to fix a broken build? What has caused it to break the most frequently? Is the build taking longer to complete than before? It is possible to answer these questions, and others, using a number of build-related reports, including Build Health, Code Coverage, Code Health, Frequent Test Failures, and Frequent Test Regressions.
Work item reports
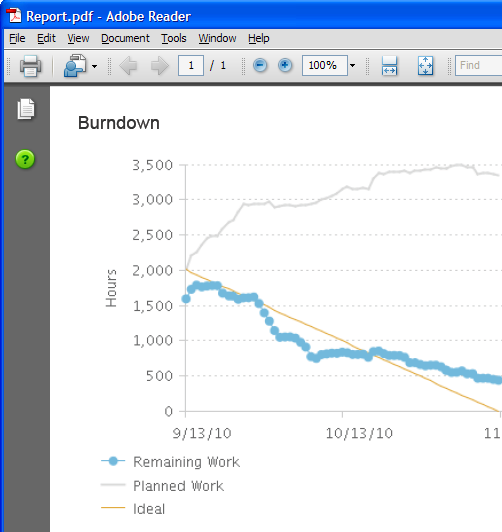
Since a work item is the representation of a piece of real-world work in Rational Team Concert, it is a hot topic for reports. A wide array of work item trend reports allows you to view new or closed work items per day, or to compare open work items between teams, open work items by type, open vs. closed work items, and more. The sprint burndown and release burndown reports will be useful to teams using the Scrum methodology, as will the story points and team velocity reports.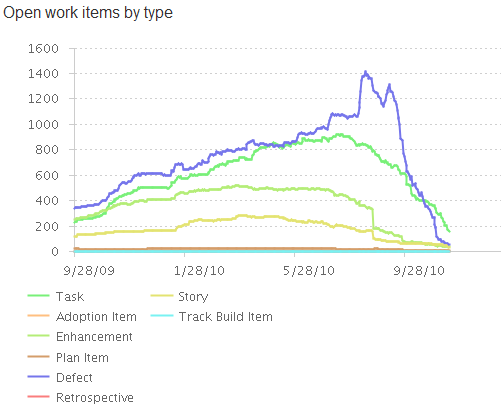
Source control reports
While viewing progress as measured by work items is valuable, sometimes you want to drill in and actually understand how much code is being produced and shared with the team. The project activity report displays an over-time view of both change sets (for a larger granularity) as well as files and folders (for a finer granularity). You can even break these numbers down by component. The stream size report shows you the trend of the size of your stream over time, both with respect to the number of files and folders as well as the size on disk.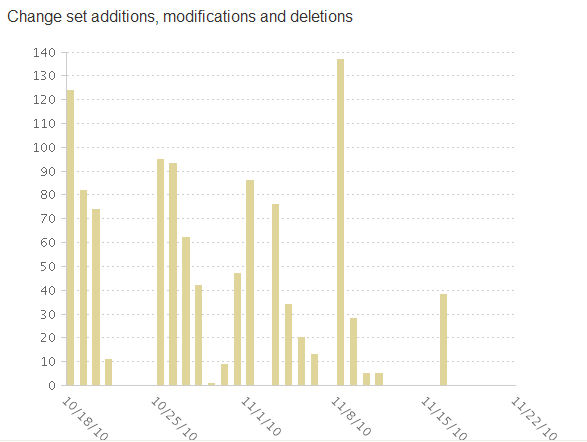
Repository and data warehouse reports
System administrators and other IT stakeholders who are interested in the health of the Jazz Team Server itself will find the repository and data warehouse reports useful. The metrics reports break down database content by item type, so you can see where the space is going and determine whether you understand the growth of the repository. The counters reports show the trend of server usage as measured by service calls. The data warehouse report shows a trend of the footprint of the snapshots in the data warehouse.Project health and team information at a glance
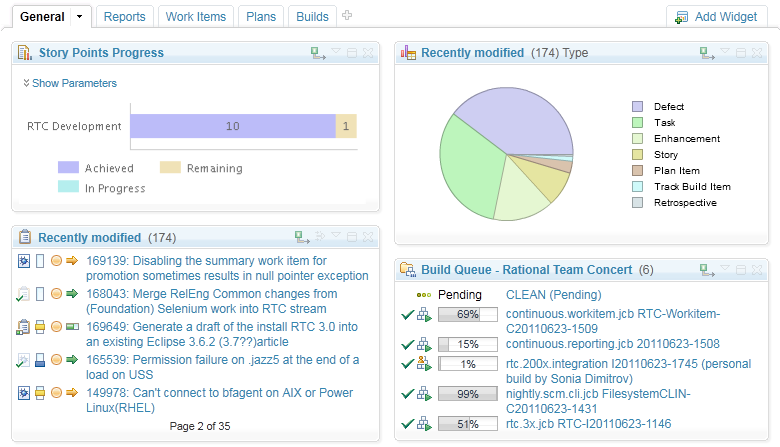
Dashboards provide a great starting point or portal for any project or team by combining and condensing various types of useful information in one place. Keep track of your project’s overall health via iteration plans, builds, trend reports, work item queries, feeds, event logs and other key data. See useful team information, links, announcements, and activity by visiting your team dashboard. Dashboards have a low barrier of entry. All you need is a browser.

Highly customizable
Dashboards are easy to create and update, and are highly customizable. You can add/remove any viewlet, drag & drop to move them around, organize them under different tabs, and configure each one to show exactly what you want. The appearance of each viewlet is also customizable. You can change titles, trim colors, and even make them trim-less so they stand out.
Mini Dashboard
The Mini Dashboard is a new sidebar added to the web UI that contains a single-column dashboard. Users can configure it to track project, team, and contributor information. Mini Dashboard can be accessed on demand within any CLM application and its contents remain consistent as you navigate between different Web UI contexts.

Personal Dashboards
Users can create, configure, and share one or more Personal Dashboards to track project, team, and contributor information. Personal Dashboards can be accessed from any CLM application that shares the same Jazz Team Server (JTS).
Widget Catalog
The Widget Catalog allows users to discover, browse, and search widget catalogs on any registered CLM application, Jazz Team Server (JTS), or friend server for Jazz Viewlets to add to their Project & Team Dashboards, Personal Dashboards, or Mini Dashboard. Users can also add external OpenSocial Gadgets and IBM iWidgets to their dashboards using the Widget Catalog.

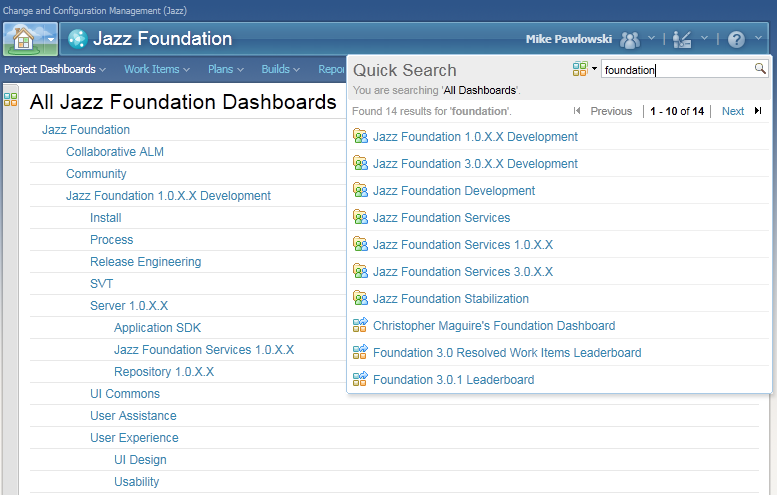
See what others are working on
With the Home Menu, Dashboard Component Menu, Quick Search, bread crumbs, and filtering, finding other dashboards is easy. You can quickly visit any project, team, or shared personal dashboard to see what others are working on.
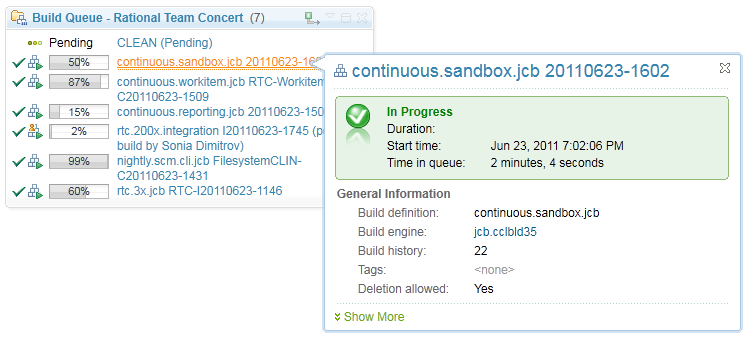
Progressive disclosure and drill-in
When there is more detailed information available for a particular item, you can hover on the item to get a tooltip showing a little more, zoom in on the viewlet to see more details for all the items, or you can click on the link to see the complete information. This includes work items, plans, builds, reports, feeds, and other key data.