
Rational Requirements Composer 4.0 performance and tuning guide
Introduction
Rational Requirements Composer provides a complete requirements management capability to define and capture business needs and manage all requirements throughout a project lifecycle. It fosters better business and development collaboration in an online agile requirements community, involving a wide set of stakeholders that can include customers, analysts, developers, testers, and anyone involved in operations and production.
Rational Requirements Composer (RRC) uses the Requirements Management (RM) application of the Collaborative Lifecycle Management (CLM) solution, which includes the Requirements Management capability. This capability provides tools to capture, organize, and collaboratively review, analyze, and report on requirements, especially in relation to their associated development work items and test artifacts.
RRC 4.0 contains significant new function as well as enhancements in many areas of the product compared to RRC 3.0.1. The goal of this article is to give guidance on how RRC 4.0 performance compares to 3.0.1 with equivalent hardware and workload. We will look at different user loads and data volumes.
This document covers the results of the scalability and performance tests conducted in a RRC-only deployment. For information on integrated CLM deployments refer to the Collaborative Lifecycle Management 2012 Sizing Guide on jazz.net. Additionally, this document provides recommendations for optimal performance.
Disclaimer
The information in this document is distributed AS IS. The use of this information or the implementation of any of these techniques is a customer responsibility and depends on the customer’s ability to evaluate and integrate them into the customer’s operational environment. While each item may have been reviewed by IBM for accuracy in a specific situation, there is no guarantee that the same or similar results will be obtained elsewhere. Customers attempting to adapt these techniques to their own environments do so at their own risk. Any pointers in this publication to external Web sites are provided for convenience only and do not in any manner serve as an endorsement of these Web sites. Any performance data contained in this document was determined in a controlled environment, and therefore, the results that may be obtained in other operating environments may vary significantly. Users of this document should verify the applicable data for their specific environment.
Server Topology
The performance tests were conducted in our in-house lab taking into account the various topologies and most of the complexities involved in a large scale deployment of the product.
The performance test environment consisted of an LDAP Server, Token License Server, database server, reporting (RRDI) server along with the Requirement Management (RM) and Jazz servers (JTS). We tested using a distributed environment with the JTS and RM server applications split into two servers see figure 1.
Distributed Topology: Separate JTS/RM/DB Server
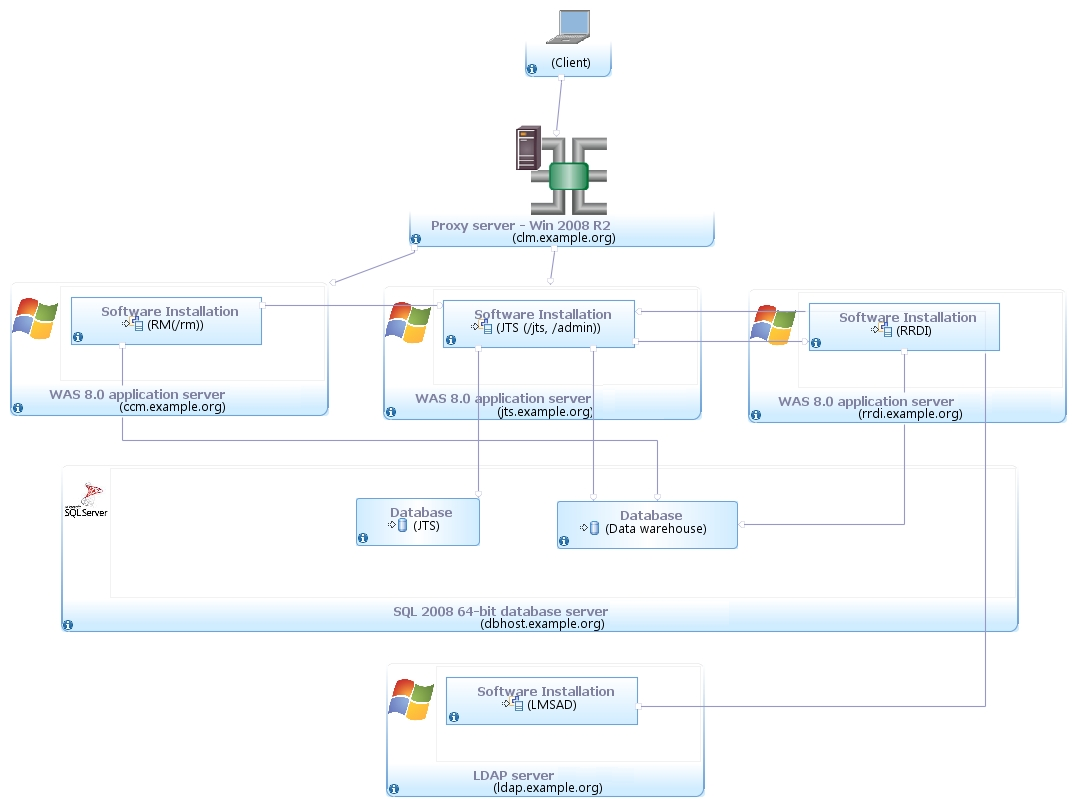
Figure 1: Separate JTS and RM Server Configuration
Hardware Configurations
The table lists the hardware used in the testing performed. All hardware is 64 bit.
| Role | Manufacturer | Model | HW Architecture | Number of processors (total cores) | Processor Speed | Memory (GB) |
|---|---|---|---|---|---|---|
| RM Server | IBM | xSeries x3550 7978AC1 | Intel Xeon | 2 | 3 Ghz | 8 GB |
| JTS Server | IBM | xSeries x3550 6234E81 | Intel E8400 | 2 | 3 Ghz | 8 GB |
| RRDI Server | IBM | xSeries x3550 7978MC1 | Intel Xeon | 4 | 3 Ghz | 8 GB |
| MS SQL Server | IBM | xSeries x3550 7978AC1 | Intel Xeon | 2 | 2.9 Ghz | 8 GB |
Workload Characterization
Rational Performance Tester was used to simulate the workload. Each user performs a random use case from a set of available use cases. Based on real customer use, our test scenario consists of a ratio of 70% reads and 30% writes. The users execute use cases at a rate of 30 pages per hour per user. Each test runs for 60 minutes after all of the users are in the system.
| Use case | Description | % Composition |
|---|---|---|
| Login | Connect to the server using server credentials. |
|
| Reports | Opens two reports from the RRDI server, generates 2 RPE reports- one 50 artifacts PDF report and one 100 artifacts MS report | 5 |
| Create Collection | Create collections with 10 artifacts | 6 |
| Create Link | Create a multiples links on an artifact | 6 |
| Filter Query | Execute a query with 100 results and Open 3 levels of nested folder. | 8 |
| Create Modify Delete | Creates a new folder, moves it to a new location then deletes it | 6 |
| Search String | Search for a string returning 30 matched items | 12 |
| Search ID | Search for a specific ID in the repository | 8 |
| View Collections | View collections with 100 artifacts from the collections folders | 12 |
| Windows Layout | Expand collapses the windows layout in the web UI | 6 |
| Add Comments | Open requirement with 100 comments and raises a comment to 8 people in the team. | 8 |
| ViewProject_Dashboard | Open the project and dashboard both for the first time and cached after opening it. | 7 |
| CreateRequirement | Create a requirement with a table, image and RichText. Also edit an artifact with 100 enumerated attributes and modify one of them. | 10 |
| Show Tree | Open folder with artifacts with links and perform a on Show tree in the grid | 4 |
| Open Graphical Ux | Open Business process diagrams, usecases, parts, image, sketch and story board graphical artifacts | 5 |
| Create Open Business Process Diagram | Create and open a business process diagram | 4 |
| Hover Collection | Open a collection with 100 artifacts and hover on the artifacts pane | 4 |
Data Volume
The repository contained 200,000 artifacts and consisted of the following:
- Small Project Count: 40
- Medium Project Count: 9
- Total number of folders: 1,810
- Total number of requirement artifacts: 202,224
- Total number of collections: 282
- Total reviews: 325
- Total comments: 243,235
- Total public tags: 479
- Total private tags: 59
- Total term count: 13,304
- Total link count: 187,329
The number of comments and links are much higher here than in the 3.0.1 test data due to differences in the way the test data was generated in 4.0. The number of folders is slightly lower than for the 3.0.1 tests. In addition to the 200,000 artifact data above we also tested with a 100,000 artifact repository.
Test Scenarios
The following scenarios were tested:
- RRC 4.0 vs. RRC 3.0.1 using same workload and hardware. 200,000 artifacts data volume
- RRC 4.0 vs. RRC 3.0.1 using same workload and hardware. 100,000 artifacts data volume
- RRC 4.0 server rename to a new public URI for JTS and RM server vs. original public URI (no rename)
Test Results
The tests we ran to gather performance and sizing data for these documents are outlined below
| Test Scenario | Test Result Summary |
|---|---|
| RRC 4.0 vs. RRC 3.0.1 200k artifacts | In both the large and the medium sized repository RRC 4.0 shows a slightly better than 50% improvement over 3.0.1 |
| RRC 4.0 vs. RRC 3.0.1 100k artifacts | |
| RRC 4.0 server rename | The renamed server showed minor performance degradation compared to using the original public URI |
Detailed Test Results
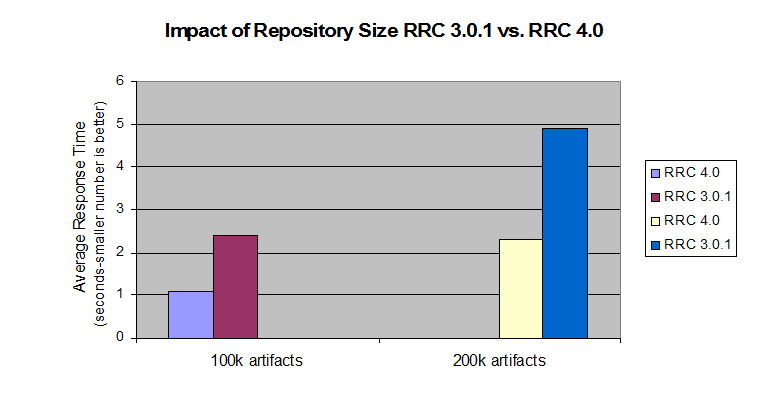
RRC 4 vs. RRC 3.0.1
RRC 4.0 shows significant improvements in the average response time compared to RRC 3.0.1 for both repository sizes. For the 100,000 artifact repository the average response time was 1.1 seconds in 4.0 vs. 2.4 seconds in 3.0.1. Average response time when using the 200,000 artifact repository is now 1.4 seconds compared to 4.9 seconds in 3.0.1. This demonstrates that scalability has improved dramatically from 3.0.1.
Use cases with the biggest improvement are folder operations (viewing contents, creating, moving), create comments, open artifacts including graphical artifacts.
Server rename scenario
The ability to change the public URI for RRC and JTS is a new feature in the 4.0 release. Our testing after renaming both the RM and JTS server URI showed only minor performance degradation vs. using the original public URI specified during setup. The performance degradation we observed amounted to 7% for the average response time. For logistical reasons the server rename test was done on different hardware from the 3.0.1 vs. 4.0 test above. The numbers are lower overall and not comparable to the 3.0.1 vs. 4.0 numbers above since the server used for this rename scenario was on faster hardware.

Recommendations for optimal performance
Application Server
IBM® WebSphere® Application Server Version 8.0.0.3 and up
Hardware sizing
By using the performance test data that we compiled, we created the tables that follow, based on the various hardware and software configurations for optimal deployment of Rational Requirements Composer server. When considering sizing options, Version 4.0 supports both dual and multitier configurations. The increased CPU load on the combined JTS/RM server limits scalability to higher user load in a dual tier toplogy. The following recommended topologies reflect this.
The three lists that follow show the sizing for different enterprise deployments.
Small-scale departmental configuration, 10,000 resources and up to 100 users:
- 2 Systems (dual tier): RRC/JTS server Quad Core CPU 2.4 GHz or higher, 64-bit; DB server Dual Core CPU 2.4 GHz or higher, 64-bit
- Memory: 4 GB or higher
- Operating system: Linux or Windows server
Medium-scale enterprise configuration, 200,000 resources and up to 200 users:
- 3 Systems (multi tier): RRC server Quad Core CPU 2.8 GHz or higher, 64-bit; JTS server Quad Core CPU 2.8 GHz or higher, 64-bit; DB server Dual Core CPU 2.4 GHz or higher, 64-bit
- Memory: 8 GB or higher
- Disk: High-performance SAS disk (15K), RAID
- Operating system: Linux or Windows server
Large-scale enterprise configuration, 200,000 resources and up to 500 users:
- 3 Systems (multi tier): RRC server Quad Core CPU 2.8 GHz or higher, 64-bit; JTS server Quad Core CPU 2.8 GHz or higher, 64-bit; DB server Dual Core CPU 2.4 GHz or higher, 64-bit
- Memory: 8 GB or higher
- Disk: SAN or NAS direct-connected disk subsystem
- Operating system: Linux or Windows server
Database server
The database server hardware other than disk storage does not impact RRC system scalability significantly. The same hardware recommendation applies to small and large scale deployments. See the disks and disk space discussion below for details on storage recommendations.
Network connectivity
Choosing network connectivity in dual-tier configurations is to minimize latency between the application server and the database server (no more than 1–2 ms), with the servers located on the same subnet. When using external storage, minimize connectivity latencies (the optimal configuration is through a Fibre Channel).
Disks
Based on the performance test results, we found that an increase in repository size along with increase in concurrent users causes significantly more load on the hard disk storage system. Therefore, for storage for large-scale deployments, consider a SAN or NAS solution with the storage directly connected through a Fibre Channel (FC) connection to avoid latency between the storage and the server. The benefits of using this configuration will allow offloading all disk I/O from the server to the NAS, while providing a complete fault tolerance disk subsystem with instantaneous snapshot backup capabilities and high availability and disaster recovery capabilities.
Disk space usage
The disk space usage for the Rational Requirements Composer server is composed of the disk space used for the Rational Requirements Composer index data and the disk space needed for the database instance. By default, the indexed data is located on the same machine as the JTS application server. Therefore, giving consideration to adequate disk space is important.
For example, for our windows repository loaded with 100,000 Rational Requirements Composer resources, the indexed data takes up 9.25 GB of disk space. The database instance must be located on a server that also has appropriate disk space. For example, the database that housed 100,000 Rational Requirements Composer resources amounts to approximately 20 GB of disk space.
Server Tuning Recommendations
The following recommendations should be noted for optimal performance:
- Use a 64-bit server with at least 8GB RAM and quad core CPUs
- Set the available TCP/IP ports to the maximum allowed by the particular hardware/OS
- Increase the thread pool size of the application container from the default
- Increase the JVM heap size to at least 4GB but never set it equal or close to equal to the toal OS memory
Available TCP/IP ports
The default number of TCP/IP ports available on AIX and Linux operating systems is too low and needs to be increased. Windows has a higher default limit but it may still be too low for large concurrent user loads. Use the instructions below to increase the port range.
AIX/Linux: ulimit -n 65000
Windows 2003 Server: Open the registry. Under HKEY_LOCAL_MACHINE/SYSTEM/CurrentControlSet/Services/Tcpip/Parameters, create a new dWord named MaxUserPort , and set its value to 65000. Restart the computer.
Windows 2008 Server: Follow the instructions in http://support.microsoft.com/kb/929851 to change the dynamic port range. Start Port : 2000 Number of ports : 63535
Thread pool size
The WebSphere Application Server thread pool size needs to be increased from the default 50 to 1.5 times expected user load. For 200 concurrent users the thread pool maximum should be 300.
JVM heap size
The WebSphere Application Server JVM heap maximum should be set to 4GB if the machine has at least 6GB of RAM. If the server machine only has 4GB RAM (not recommended) a maximum between 2GB and 3GB needs to be experimented with. Never set the maximum heap size to more than 70-80% of the maximum available machine memory or you will see poor performance.
Additional suggestions
In a three server topology (JTS and RM servers on separate hardware) two settings in the fronting.properties need to be adjusted for loads higher than 200 concurrent users:
- com.ibm.rdm.fronting.server.connection.route.max – should equal the number of users
- com.ibm.rdm.fronting.server.connection.max – should be twice that value.
When using a proxy/reverse proxy server the maximum allowed connections on the proxy server may have to be increased based on the concurrent user load. Refer to the IBM HTTP Server tuning recommendation for more information.
Database optimization
To ensure optimal database performance, it is necessary to ensure that the database is fully optimized. With both DB2 and Oracle, you can run statistics to allow the databases to analyze the shape of a schema and optimize the contents. Databases generally manage statistics automatically (in a scheduled overnight operation, for example). However, to ensure that the database is fully optimized you may manually run the statistics as follows.
DB2
DB2 REORGCHK UPDATE STATISTICS ON TABLE ALLOracle
EXEC DBMS_STATS.gather_schema_stats(' JAZZDBUSER' );For more information
- Collaborative Lifecycle Management 2012 Sizing Guide
- Collaborative Lifecycle Management 4.0 Infocenter
Copyright © 2011, 2012 IBM Corporation