Case Study: Examining Rational Team Concert performance with WebSphere Application Server and Tomcat
Introduction
The choice of an application server is not merely technical, e.g. performance or scalability, but value driven in terms of cost of the application server, licenses, operations, setup and configuration time, ease of use, enterprise requirements for high availability or fail-over and reliability. Although performance and scalability explorations of the product in lab environment are constrained by time and a smaller subset of real world use cases, it provides us first hand insight into the detailed technical aspects. This article is a way to share our experience and observations of performance and scalability based on preliminary data and conditions present during the experiment. The intent is to provide an objective view of the results found by hosting Rational® Team Concert™ 3.0.1 on both IBM® WebSphere® Application Server and Apache™ Tomcat™ application servers and technical details for the audience’s consideration.
The article presents system utilization and server statistics of Rational Team Concert 3.0.1 hosted on two commercial application servers such as IBM WebSphere Application Server v7.0.0.15 and Apache Tomcat v5.5.30. The WebSphere Application Server configuration demonstrates increased throughput than the Tomcat configuration as the system resource utilization is less and the server web service response times are faster in WebSphere Application Server.
The application is configured in a dual-tier fashion. One physical server is dedicated as an application server and another as backend database server. The server topology diagram is represented in Figure 1.
Figure 1. Server topology overview
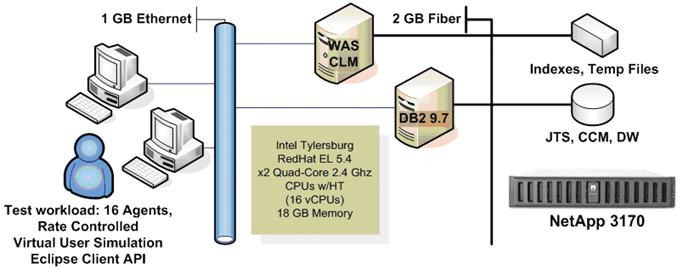
The application and database servers in the dual tier configuration are both similar. Each server has Intel 5500 chipset which comprises 64-bit Dual 2.64GHz CPU with 4 Cores with Hyper-Threading enabled resulting in 16 virtual CPU, 18GB physical RAM, 1 GB Ethernet network connection, and a direct 2GB fiber channel connection to a NetApp® 3170 device providing a fast disk storage system. The application and database server are running on RHEL v5.4. The application indexes, temporary files and database tablespace container are stored on the NetApp FC LUN partitions formatted as EXT3. The database server is hosted on 64-bit DB2 v9.7.0.2.
System performance
A standard test workload is run for 4 hours on RTC configured mutually exclusive for WebSphere Application Server and Tomcat. The system resource utilization is calculated via nmon performance tool. Figure 2 shows percentage of CPU time spent in user and kernel space of the system running application server. The system shows 17% higher average CPU consumption in Tomcat configuration as compared to WebSphere Application Server configuration.
Figure 2. CPU utilization comparison
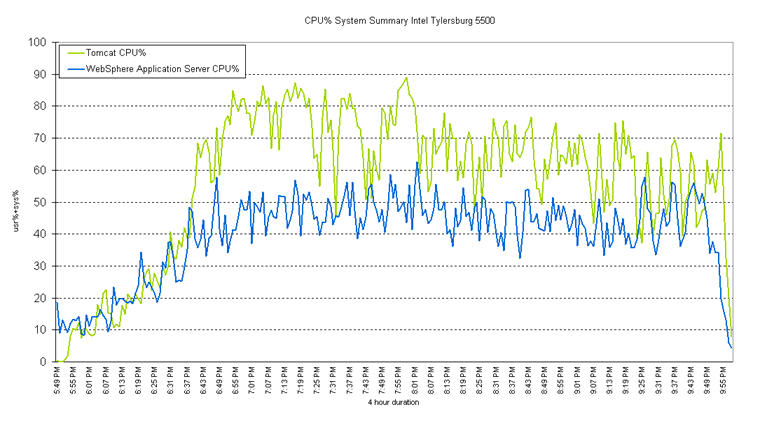
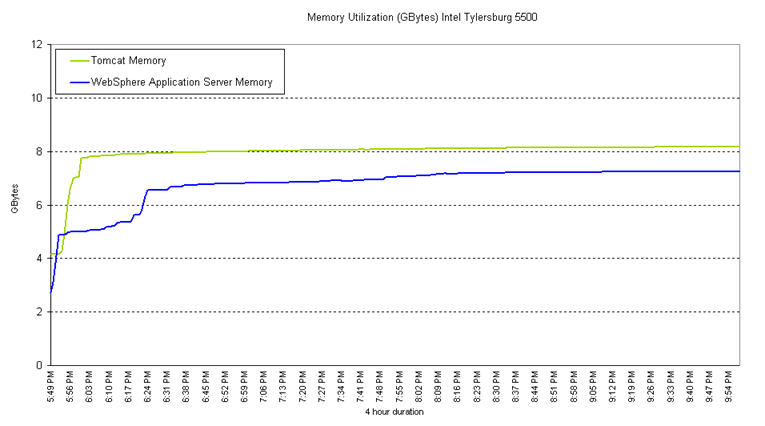
Figure 3 shows memory consumed by the system including user and kernel space. Unlike conventional processes, the JVM will keep the allocated memory once it reaches the maximum heap limit (set via -Xmx) even if the high workload only needs to be briefly maintained. The system shows 6% higher average memory consumption in Tomcat configuration as compared to WebSphere Application Server configuration
Figure 3. Memory utilization comparison
The WebSphere Application Server configuration used less CPU and memory utilization with increased disk utilization suggesting a well tuned application. WebSphere Application Server configuration demonstrated increased throughput with 2656 disk transfers per second as opposed to 2397 in the Tomcat configuration.
Server average responses
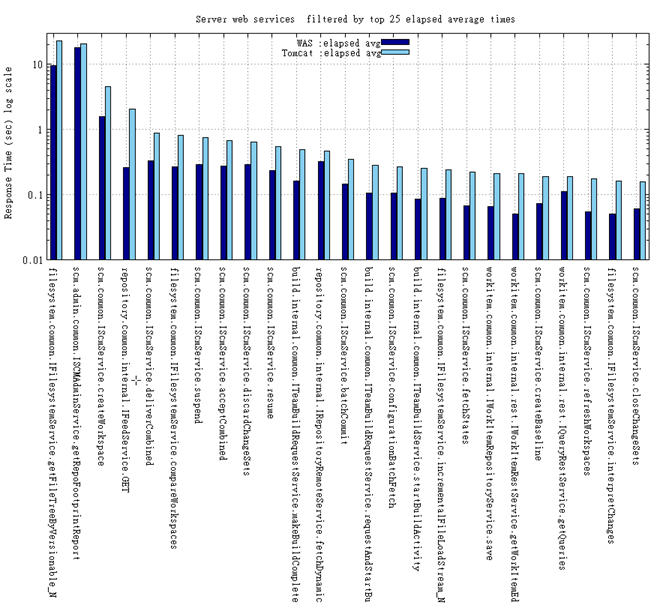
Figure 4. depicts the server side web services elapsed response time on a log scale for the response time on Y axis. The log scale captures the large degree of variation between the web services while capturing the essence of the response time data. The server side web services listed on the X axis are the services such as SCM, Builds and WorkItems provided by the application as invoked by the use cases as simulated in the standard test workload.The elapsed average response time are faster in the WebSphere Application Server configuration as compared to Tomcat configuration.
Figure 4. Server web services sorted by elapsed average response time
Repository contents
The initial state of the repository was identical in both WebSphere Application Server and Tomcat configurations. The repository consists one project area, 50 streams and approximately 3,500 artifacts before the test workload is run. Table 1. provides repository details such as number of artifacts and size, before and after the end of the 4 hour run duration.
Table 1. Repository content after 4 hour run duration.
Initial State | WebSphere Application Server | Tomcat |
|---|---|---|
| 3,500 artifacts | 144,718 artifacts | 140,636 artifacts |
| 6MB | 614MB | 601MB |
Tuning for performance
The next three sections in this article delve into the details of tuning the application server, database server and application to achieve the performance results described above.
Tuning application server
The maximum number of open files descriptor is set at a higher value than the default on Linux/UNIX in order to support parallelism for the CLM/RTC server hosted on an application server. This value is set to:
ulimit -n 12000
Table 2. Application server tuning parameters
Application Server Configuration | WebSphere Application Server | Tomcat |
|---|---|---|
| Thread Pool minimum size | 50 is default WebContainer minimum size. | minSpareThreads=25 and maxSpareThreads=72 are default Connector attributes in server.xml. |
| Thread Pool maximum size | 500 is WebContainer maximum size. | 500 is maxThreads Connector attribute in server.xml. |
| Thread/Connection inactivity timeout | 60000ms is default. | 20000ms is default. |
| JVM initial memory size -Xms | 100M is default for WebSphere Application Server on Linux platform. | 4M is default for JVM on Linux platform. |
| JVM maximum memory size -Xmx | 4096M | 4096M |
In the WebSphere Application Server configuration the LPTA token timeout paramter (in Global Security) is set to 300 minutes instead of the default 120 minutes to avoid excessive timeout warning messages being recorded into the WebSphere Application Server system logs.
Tuning database server
For this case study 64-bit DB2 v9.7.0.2 is used a backend database server to store the jazz repository. The database is created with 32K page size and the UTF-8 code-set. The log file size is increased to 64MB from the default of 4 MB. The unit of measure of LOGFILSIZ is Pages each of 4 KB in size.
db2 create database databasename using codeset UTF-8 territory en PAGESIZE 32768 db2 connect to databasename db2 update database configuration using LOGFILSIZ 16384 db2 disconnect current
The database tablespace container CONTENTTS is stored on the NetApp FC LUN partition. It is defined in the teamserver.properties or in the Admin GUI as:
Table 3. Database server tuning parameters
Admin GUI – Advanced Properties | teamserver.properties | Value | Application |
|---|---|---|---|
| Core Repository Component – Content tablespace location | com.ibm.team.repository.db.db2.content.tablespace.location | Location pointing to NetApp LUN partition directly connected to the database server via fiber channel | JTS and CCM |
| Data Warehouse – Database Table Space Folder | com.ibm.team.datawarehouse.db.base.folder | Location pointing to NetApp LUN partition directly connected to the database server via fiber channel | JTS and CCM |
An additional optimization configuration is set for improving performance on large databases is applied to DB2 which is a one time setup during installation of the DB2 software.
db2set DB2_OPTPROFILE=YES db2stop db2start
Tuning application
The JTS and CCM application can be tuned by logging into the administration GUI via a product supported web browser or by changing the teamserver.properties file. All of the configuration paramters in the Table 4. are set to a location pointing to NetApp LUN partition directly connected to the database server via fiber channel.
Table 4. Application tuning parameters
Admin GUI – Advanced Properties | teamserver.properties | Application |
|---|---|---|
| Full-Text – Index Location | com.ibm.team.fulltext.indexLocation | JTS and CCM |
| Jazz Foundation Services – History Directory | com.ibm.team.jfs.lucene.history.directory | JTS and CCM |
| Jazz Foundation Services – Directory | com.ibm.team.jfs.lucene.directory | JTS and CCM |
| Jazz Foundation Services – Jena TDB History Index | com.ibm.team.jfs.jena.tdb.history.dir | JTS and CCM |
| Jazz Foundation Services – Jena TDB Live Index | com.ibm.team.jfs.jena.tdb.storage.dir | JTS and CCM |
| Core Repository Component – Content Temporary Directory | com.ibm.team.repository.tmpdir | JTS and CCM |
| SCM – Versionable Content Temporary Directory | com.ibm.team.scm.vcs.tmpdir | CCM |
| SCM – Content Temporary Directory | com.ibm.team.scm.tmpdir | CCM |
The JDBC Connection Pool Size and Mediator Pool Size are increased to accomodate bursts of traffic from the client side. The pool size of 12,000 is approximated as max_clients * 25 derived from the RTC tuning guide. In this case study the client side load generates approximately less than 600 threads.
Alternatively increasing the connection pool sizes to a high value causes the servers to consume extra system resources as the application does not close the open connections. If the connection pool size is a bottleneck the application will throw following exception in the application server logs.
"CRJAZ1413E A connection to the database could not be acquired in 3000 ms. This can happen if your server is under very high load, or if your DB server is not powerful enough to quickly process the requests from this server. The primary resolution to this problem is to use a more powerful DB server. If this problem is intermittent, increasing the JDBC Connection Pool Size or JDBC Connection Pool Wait Time properties in the Advanced Properties page might help you avoid the problem in those rare cases."
The connection pool sizes can be monitored either on the application server or the database server by running the following command.
netstat -a | grep machinename | wc -l
The machinename is the name of the database server if this command in run on the application server and vice-versa.
Table 5. Application tuning parameters: pool sizes
Admin GUI – Advanced Properties | teamserver.properties | Value | Application |
|---|---|---|---|
| Core Repository Component – JDBC Connection Pool Size | com.ibm.team.repository.db.jdbc.pool.size | 12000 | JTS |
| Core Repository Component – Mediator Pool Size | com.ibm.team.repository.rdb.mediator.pool.size | 12000 | JTS |
Beyond the case study
There are additional factors that one must walk through in order to make a choice of an application server for the enterprise. A typical IT enterprise comprises of software developers and production administrators. Although Tomcat appeals software developers for the upfront ease of use and simplicity there is an extra overhead for the production administrators to manage the customizations to installation, configuration and monitoring that are developed over the project lifecycle. WebSphere Application Server provides an in-depth administrative console with in-built monitoring, extensive product documentation and a 24×7 support team.
Considering all of the above factors for over a long period of time the hidden Total Cost of Ownership of a simple open source application server may reduce the value generated for the enterprise. A Javaworld.com article Is Tomcat enterprise ready? discusses detailed technical architecture of Tomcat and WebSphere Application Server. Listed below is a summary of the TCO consideration in this article."It is not uncommon for Java enterprise applications to scale along the lines suggested by the example in this article, growing in complexity as new requirements are added. While Tomcat might suit your initial application requirements, it could become problematic in the long run, as the system gradually requires more complex deployment, management, and monitoring solutions. A Java EE application server (i.e. the WebSphere family) is more scalable than a Web server, providing tight integration between containers and deployment contexts for each additional technology. In many cases, choosing a Java EE app server is the more cost-effective solution for the long run."
Conclusions
The system resource utilization performs better in WebSphere Application Server configuration than Tomcat configuration with reduced server web service response times yielding increased throughput for the WebSphere Application Server configuration. The case study should be further explored by running the workload for longer to uncover reliability aspect of the server configurations and reducing the workload to a smaller scale to address mid scale enterprise requirements.
The performance tuning is based on the experience of iterative testing in the development lab, a well defined acceptance criteria, product documentation and reference materials provided below in the article.
Trademarks
“Apache Tomcat” and “Tomcat” are trademarks of the Apache Software Foundation.
For more information
- RTC tuning guide
- Case Study: Tuning WebSphere Application Server v7 and v8 for performance
- Collaborative Lifecycle Management 2011 Sizing Guide
- DB2 optimization
- NMON tool for analyzing system performance
- Is Tomcat enterprise ready?
About the author
Chetna Warade is working as Software Engineer for the IBM for over 8 years. She is part of the Rational Performance Engineering group. She can contacted at warade@us.ibm.com.
© Copyright 2012 IBM Corporation