
Rational Quality Manager 3.0.1 server sizing guide
Table of contents
Overview
Disclaimer
Server topology
Hardware configurations
Workload characterization
Data volume
Repository size observations
Tests executed/ results
Hardware sizing examples
User load/ repository size recommendations
Server tuning recommendations
How does RQM 3.0.1 compare to 2.0.1?
Overview
The aim of this document is to provide guidance to sales teams and customers in specifying the appropriate deployment architecture for IBM Rational Quality Manager 3.0.1. It provides specific results and analysis of performance testing that was performed on IBM Rational Quality Manager 3.0.1. The results of those tests provide guidance on recommended hardware and deployment topologies.
Disclaimer
Each IBM Rational Quality Manager installation and configuration is unique. The performance data reported in this document are specific to the hardware, product software, test configuration, workload and operating environment that were used. The reported data should not be relied upon, as performance data obtained in other environments or under different conditions may vary significantly.
Server topology
Our distributed test environment consisted of Quality Manager (QM) and Change and Configuration Management (CCM) applications installed on one server, Jazz Team Server (JTS) application installed on another, along with Rational Reporting for Development Intelligence (RRDI), Lightweight Directory Access Protocol (LDAP), and database and token license servers. See figure 1 below.
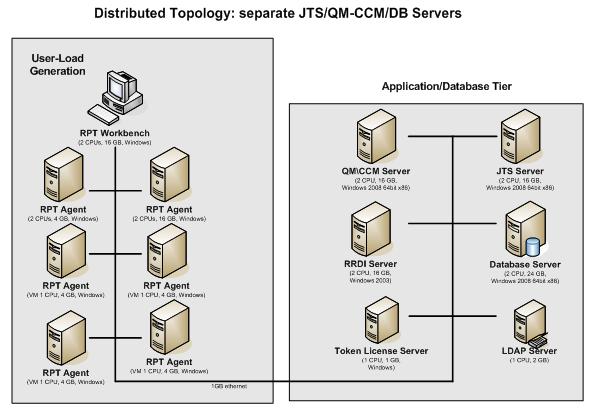
Figure 1: Separate JTS,QM-CCM and database server configuration
Hardware configurations
The following tables detail the configuration of the specific machines used in the above topology. Each table lists the specific machine used including the role, system model, processor type, number of processors and speed, amount of RAM, as well as specific operating system version (including any service or fix-pack levels). Table 1 captures the machine characteristics of the systems under test and Table 2 captures the machine characteristics of the user load environment.
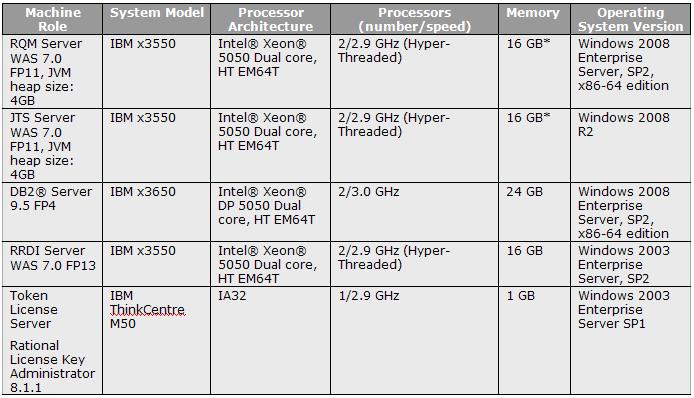
Table 1: Machine characteristics of systems under Test
* Note: Only 4GB of memory was allocated to Java JVM as the test objective was to measure system performance with smaller amount of memory.
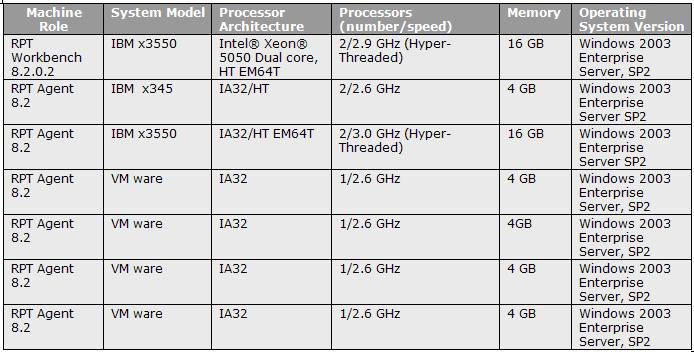
Table 2: Machine characteristics of user load environment
Workload characterization
IBM Rational Quality Manager supports a variety of user roles. Therefore, the workload of this exercise simulates a series of role based scenarios that attempts to mimic simple real-world user tasks. Each user simulated through IBM Rational Performance Tester was assigned a user role based on the following realistic set of workloads. Note: Two different workloads were used in this test (with and without report use cases):
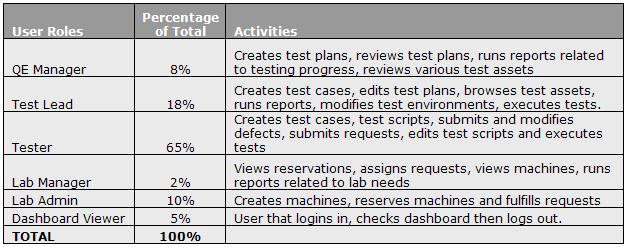
Table 3: User simulation activities
Data volume
The following table shows the asset mix in the repository at the beginning of each test run. Four different size repositories were used in our test: 100K assets, 500K, 1000K and 1500K assets.
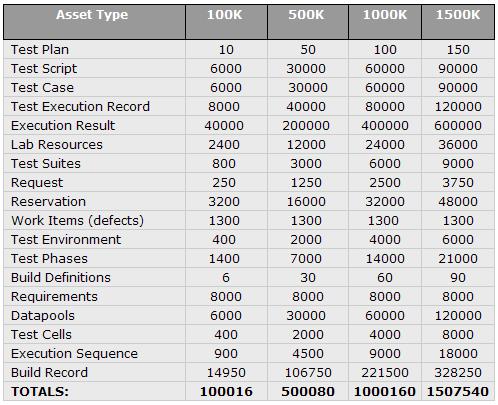
Table 4: Asset mix
Repository size observations
Determine the disk resources needed by IBM Rational Quality Manager assets. The size on disk per 1,000 assets was determined by creating an empty repository on the database server machine, and then using custom data creation scripts to generate 1,000 of each type of asset. The assets generated included fixed sized data (see center column). The database used for this exercise was an IBM DB2 9.5 database.
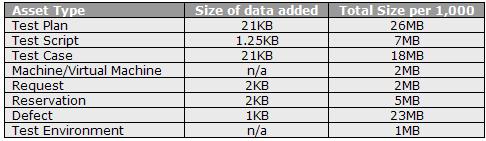
Table 5: Sample asset sizes
Tests executed/ results
The following tests were executed and had these results:
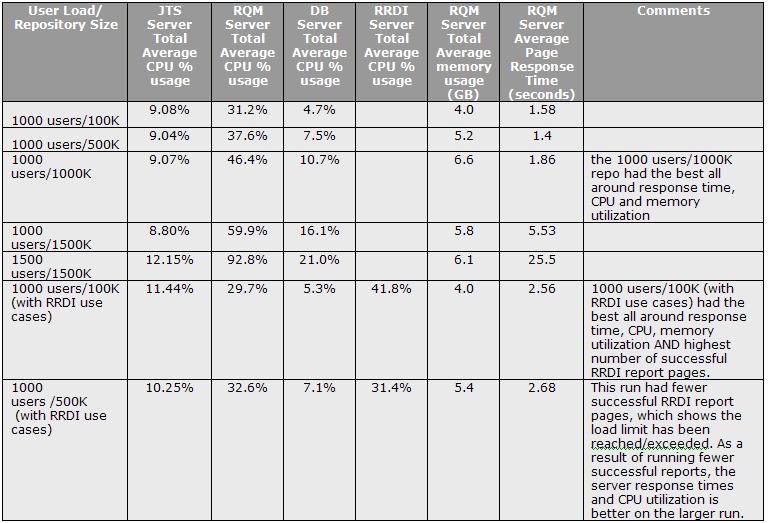
Table 6: Test executed/ results
Hardware sizing examples
Table 7 details server sizing examples extrapolated from the test results provided in this document and not the full range of available options for hardware, operating systems and database vendors. Also the performance of any specific deployment is ultimately dependent on a large number of factors including (but not limited to) specific hardware used, number of users, workload, number and mix of assets, network topology, tuning of hardware and software, presence of network traffic, etc. Therefore, these examples may not be suitable for any deployment that deviates from the conditions and workloads described below. Our testing attempts to simulate a real-world workload, but no simulation can fully account for the complex behaviors of a team of end-users. To get specific advice based on your workload and hardware constraints, have your IBM sales team contact a Techline representative.
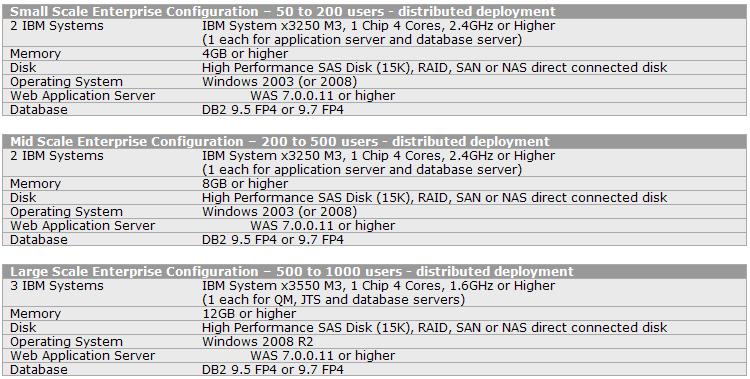
Table 7: Server sizing examples
User load/ repository size recommendations
Based on our test configuration, workload and operating environment used for the test, the upper bound (maximum) user load/repo size combination with the best performance characteristics was up to 1000 users with 1000K RQM assets. For environments configured with RRDI server, the user load/repo size combination with the best performance characteristics was 1000 users with 100K RQM assets. Note: of the 1000 users in this workload, 45 users were running 1 of 5 different reports.
Performance examples:
Operating system
Microsoft Windows 2008 R2
Database
DB2 64-bit, version 9.7 FP4
Application server
WebSphere Application Server 64-bit, version 7.0.0.11 and higher
Note: RRDI installs and supports 32-bit WAS only.
Network connectivity
The network which connects distributed deployments (application and database servers) must be high speed (1 GB/s encouraged) and low latency (1 to 2 ms) and should be on the same subnet, without a firewall between them.
Disk storage
Disk storage performance is one of the most critical elements of optimizing performance; this is especially true for the database server as the larger the user load, the higher the disk I/O. In our testing we found that a 32-bit database server with standard disk configuration was not adequate to handle the larger user loads; disk idle time was nearly always zero. Switching to a 64-bit server/OS database server solved this problem. As such we recommend several internal SAS drives configured with RAID 10 or for even better performance use NAS disk subsystem with direct fiber channel connection.
Disk space usage:
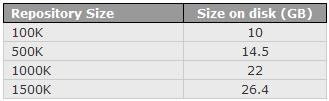
Table 8: Our test repository size on disk
Note: our test servers used four databases as follows: QM, CCM, JTS and data warehouse; all included in the figures above.
Server tuning recommendations
Application server
- WebSphere Java Heap: set Application servers > server1 > Process definition > Java Virtual Machine > Maximum heap size to 4096mb (4GB) if you system has a minimum of 6GB total system memory
- On our RQM and JTS servers, we set the WebSphere Thread Pool size to 500 (Application servers > server1 > Thread pools > WebContainer > Maximum Size). If using Tomcat, the maxThreads size needs to be set accordingly in the server.xml.
- On our RQM and JTS servers, we enabled servlet dispatching (recommended for larger user loads). If using Tomcast add the following line to your server.startup.bat: set JAVA_OPTS=%JAVA_OPTS% -Dcom.ibm.team.jfs.app.http.client.dispatchingEnabled=true
If using WAS, in WebSphere v7.x set Application servers > server1 > Process definition > Java Virtual Machine > Generic JVM Arguments to:
-Dcom.ibm.team.jfs.app.http.client.dispatchingEnabled=true
then in Custom Properties add name/value pair: name: JAVA_OPTS, value: %JAVA_OPTS%
Database
DB2 server, INSTANCE_MEMORY:
On a 32-bit operating system, ensure that INSTANCE_MEMORY is set below 3GB (2GB on Windows without /3GB). Do not rely on INSTANCE_MEMORY set to automatic to stay below this upper limit. In our tests on a 32-bit operating system our value was 512,000; on our 64-bit operating system with 8GB of RAM, INSTANCE_MEMORY set to automatic worked well.
DB2 buffer pools ‘self tuning’:
Since some of our tests included RRDI use cases, we found running of ETL to create data warehouse data worked well when the data warehouse database had buffer pools set to use self-tuning. To check if your DB2 data warehouse database uses self-tuning, open the DB2 Control Center and navigate to: All Databases > [database name] > Buffer Pools; the far right column shows status of self tuning.
How does RQM 3.0.1 compare to 2.0.1?
There were several performance improvements in the 3.0.1 release. Figures 2 and 3 show significant performance improvements from the 2.0.1 release. Figure 2 shows improvement in comparing Rational Customer Report (RCR) use cases vs. Rational Reporting for Development Intelligence (RRDI) use cases with a 1000 user load and 100K asset repository. Figure 3 shows test runs without report use cases, 1000 user load with both 100K and 500K asset repositories.
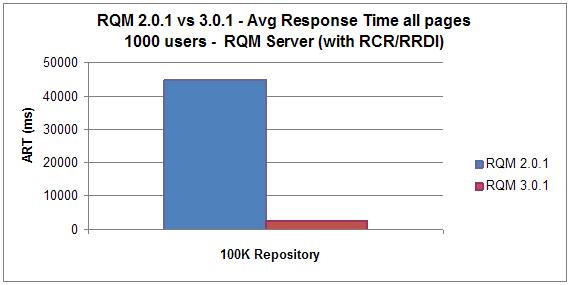
Figure 2
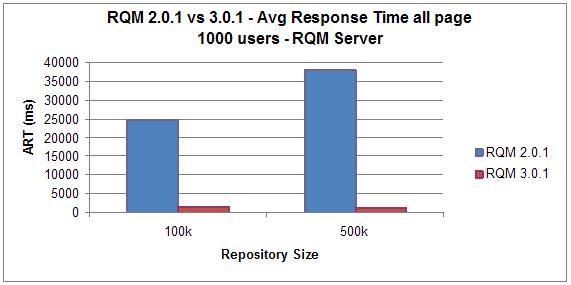
Figure 3
Legal notices
IBM, the IBM logo, and Rational are trademarks of IBM Corporation in the United States, other countries, or both. Java and all Java-based trademarks are trademarks of Sun Microsystems, Inc. in the United States, other countries, or both. Windows Server is either a registered trademark or trademark of Microsoft Corporation in the United States and/or other countries. Other company, product, or service names may be trademarks or service marks of others.
© Copyright 2011 IBM Corporation