Cool “Hidden” Features in Rational Team Concert: Part 1
Introduction
Rational Team Concert (RTC) was a very functionally-rich product when it was first released in the summer of 2008, and since then many new and powerful features have been added. Much more is coming this autumn with the 3.0 release.
Included in the mix of these features are some that, for whatever reason, are somewhat difficult to discover. They often can only be found by accidentally stumbling upon them in the product itself, or by chance in the documentation.
This article aims to briefly discuss a half-dozen or so such features in RTC. Likely you know of a few of these, but I suspect that most people are not aware of all of them. This list is far from exhaustive; if you have ideas for others to include in future articles, please email them to me at garymu@us.ibm.com.
Process Configuration History
An RTC project manager will often make numerous process configuration changes over the life of a given project. It is difficult to remember all of the modifications that were made, either those made via the various editors available, or directly in the XML source.
Thankfully, there is a mechanism available to show the history of changes made to the process configration, and then compare any two revisions to show the difference(s) between the two.
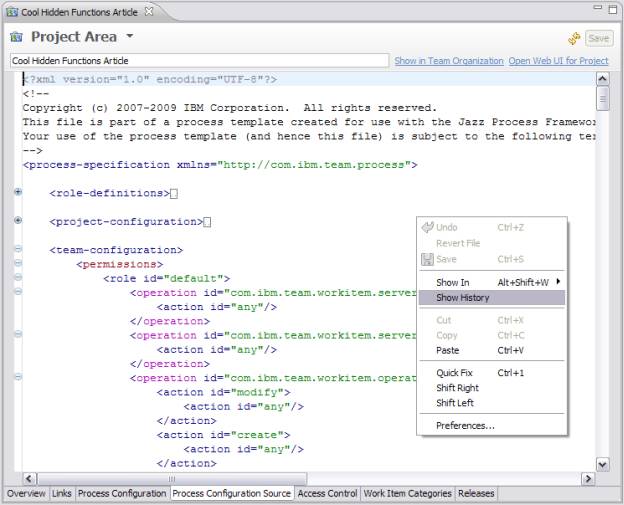
- To start, open up your project, and move to the Process Configuration Source tab. Right click anywhere in the editor and select Show History as shown below:
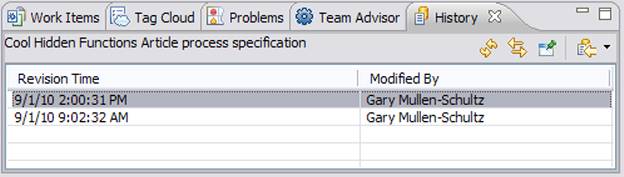
- This will open up the History view populated with all revisions to the process as shown in this simple example here:
- Now, select any two revisions and right click. You’ll see the option to compare the two as shown:
Note: The ability to do this (select and compare) is true for many artifacts in RTC. Other examples include: build results, snapshots, baselines, and more.
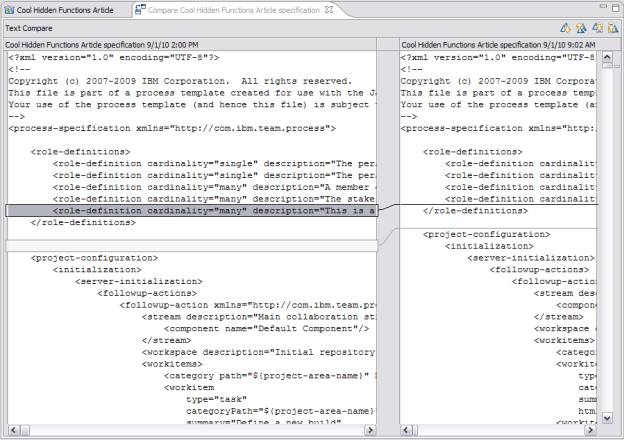
Selecting the Compare option opens up the XML comparison view, with annotation and navigation available for changes between the two selected revisions. In this instance, I made a single change to the project: I added a new role.
Internal Tools
Some additional internal Jazz tools are available by adding a parameter to your administration URL as follows:
https://localhost:9443/jazz/admin?internal=true
Invoking the main administration web page in this manner will result in the following. Note the Internal Tools section highlighted in a red box:
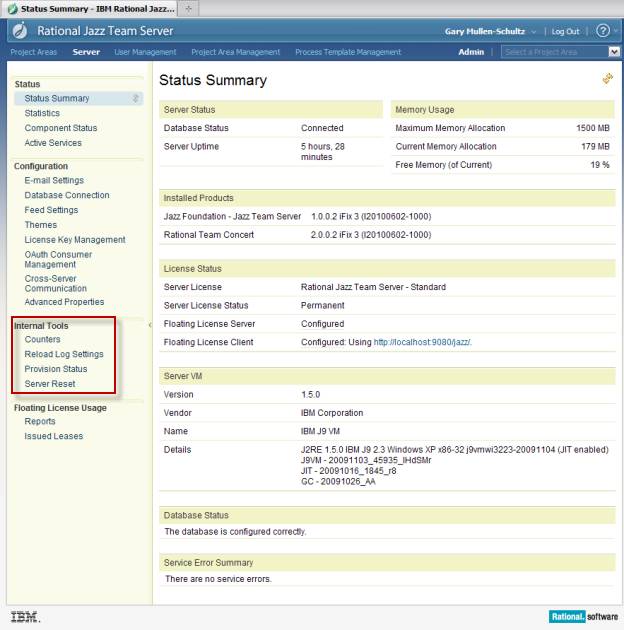
These tools perform the following actions:
Counters
Invoking this menu option brings up a screen showing detailed invocation counts and elapsed time data (minimum, maximum, average, total) for functions such as caching, database queries, web service calls, etc. It can be useful to help pinpoint areas causing performance and scalability problems, and is of great value to IBM Support.
Reload Log Settings
In the $JAZZROOT/server/conf/jazz directory is a file called log4j.properties. This file controls what and where the RTC server logs. For example, the size, location, etc. of the traditional jazz.log file is controlled there.
Sometimes it is helpful to change a logging attribute, such as changing the level of messages logged from the default of WARN to a more verbose level of DEBUG. Typically a server restart is required to make such changes take effect; the Reload Log Settings feature allows you to make logging configuration changes take effect without a server restart. Simply make your desired change(s) to log4j.properties and invoke the Reload Log Settings function. Your changes should be used immediately.
Provision Status
The management of user extensions, as well as many built-in functions, is handled by the provisioning services of Jazz. These are built using the Eclipse methodology (see my previous article Rational Team Concert – Creating Custom Operation Advisors to get more information).
The Provision Status page shows what features have been installed onto the server, and the actual jars that comprise those features. This information is helpful not only to determine whether your custom extension was properly provisioned, but also to glean more information about built-in functions (for example, understanding what jars implement which RTC features). It’s also a valuable place to go to understand what version of a given jar file is active in the server.
Server Reset
You would use the Server Reset option to force the Jazz server to “reprovision itself” the next time it is restarted. This is used, for example, to get the server to load a new feature that has been specified in an .ini file located in the $JAZZROOT/server/conf/jazz/provision_profiles directory. It is also used when changing the underlying application server from Tomcat to WebSphere.
Change Explorer – Save Change Log
The Change Explorer view is a great place to (as its name implies) explore changes between two versions of a given artifact. For example, if you choose to compare two snapshots with each other, this view will let you investigate every change set that occurred between the two artifacts.
This is great for a quick visual perusal, but what if you want to filter out certain changes? What if you need to send someone a list of every change made to a stream in source control between two snapshots?
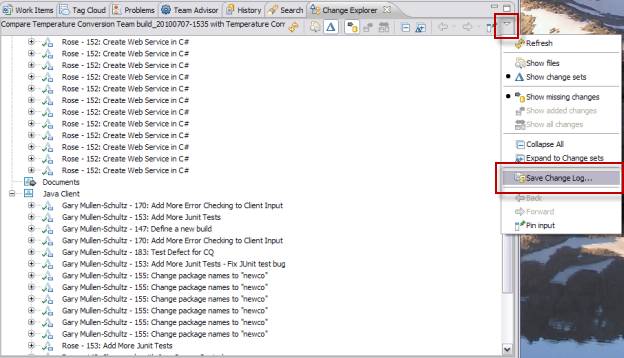
The Save Change Log… option allows you to accomplish these tasks. It is available by clicking the Menu arrow at the top-right corner of the Change Explorer view as shown in a red box in the following diagram:
Selecting the Save Change Log… menu item results in the following dialog:
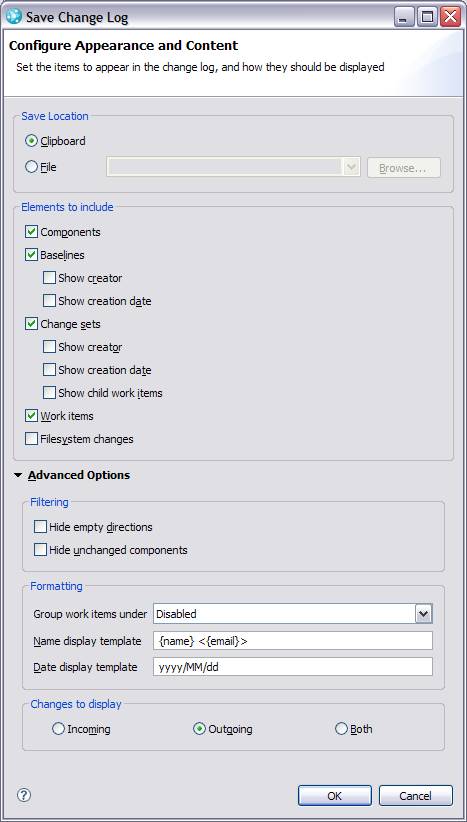
As you can see, this dialog gives you great flexibility in selecting exactly which changes will be sent to the log, and where (Clipboard or file). The resulting log file can contain a great deal more information than just the Pending Changes view, as shown in this snippet:
Rose <rose@bombshelterstudios.com> 178: Create Server-Side NUnit Tests 2010/06/08 Work Item 178: Create Server-Side NUnit Tests /TempConversionWebService/TempConversionWebService/Tests.cs Gary Mullen-Schultz <garymu@us.ibm.com> 178: Create Server-Side NUnit Tests 2010/07/01 Work Item 178: Create Server-Side NUnit Tests /TempConversionWebService/TempConversionWebService/Tests.cs Rose <rose@bombshelterstudios.com> 168: Create Web Service NUnit Tests 2010/07/07 Work Item 168: Create Web Service NUnit Tests /TempConversionWebService/TempConversionWebService/Tests.cs Component Documents (removed) Component Java Client Gary Mullen-Schultz <garymu@us.ibm.com> 148: Share code with Jazz Source Control 2009/09/02 Work Item 148: Share code with Jazz Source Control /TempConvertClient/src/build /TempConvertClient/src/build/build.xml Gary Mullen-Schultz <garymu@us.ibm.com> 148: Share code with Jazz Source Control 2009/09/03 Work Item 148: Share code with Jazz Source Control /TempConvertClient/.classpath /TempConvertClient/src/com /TempConvertClient/src/com/newco/tests /TempConvertClient/src/com/newco/tests/Test.java
Using Content Assist (Ctrl+Space) in Work Item Description and Discussions
Java developers who use Eclipse as their IDE have known and loved the power of its Content Assist (Ctrl+Space) feature for over a decade. It provides context-sensitive prompting to help complete and/or fill in a desired entry. For example, when writing Java code, typing the name of an object and a period, followed by invoking Content Assist, results in a display of all methods available for that object. Typing a w and then Ctrl+Space results in a list of all available methods starting with the letter w.
RTC has taken advantage of this powerful facility in several areas. One prominent place is in the Description and Discussions sections of a work item. For example, selecting Ctrl+Space inside the Description text box of a given work item results in the following:
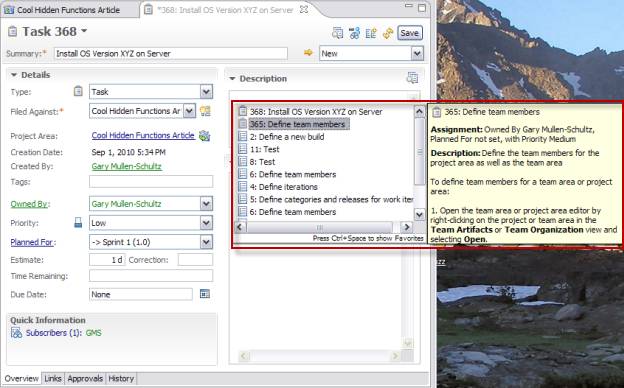
Pressing Ctrl+Space further times will cycle through various types of lists, for example “Favorites”, “Users”, etc.
This exact same functionality is available in the Discussions section of work items as well.
Metronome Tool
Some team collaboration components, such as source control management (SCM) tools, have performed poorly in certain networking configurations – for example, when used in a WAN environment. The SCM built into RTC is designed to perform will in most commonly-used networking configurations.
Nevertheless, there are still times when it’s important to gather some detailed usage and performance data for various features of your team collaboration server. That’s where the Metronome Tool comes in.
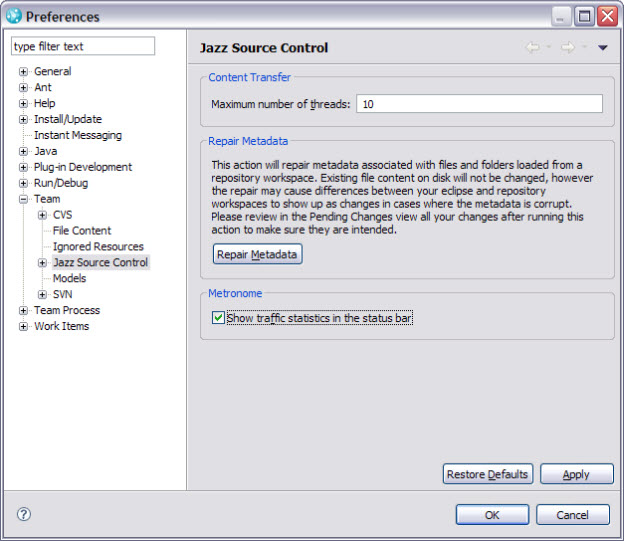
To turn on the Metronome Tool, go to the Window > Preferences > Team > Jazz Source Control. Even though it’s under the Jazz Source Control dialog, the Metronome gathers performance data for many Jazz components. Enable the Show traffic statistics in the status bar check box as shown in this screen shot:
You will now see new information in the status bar. Depending on your individual screen layout it may appear in different places in your client. In the image below, it is in the lower-right-hand corner of my IDE, and is shown in a red box:
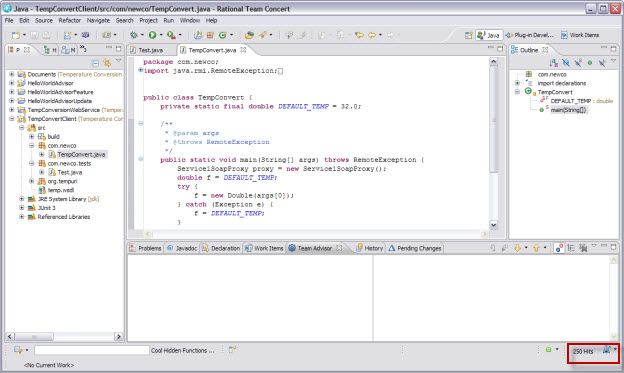
In this screen shot, “250 Hits” simply indicates how many times the client has had interactions with the RTC Jazz server. You can reset this number simply by clicking on it.
The icon to the right is of more interest. By clicking on this (you can also specify which RTC repository you are interested in, if you have metronomes active for more than one), you get a dialog like this:
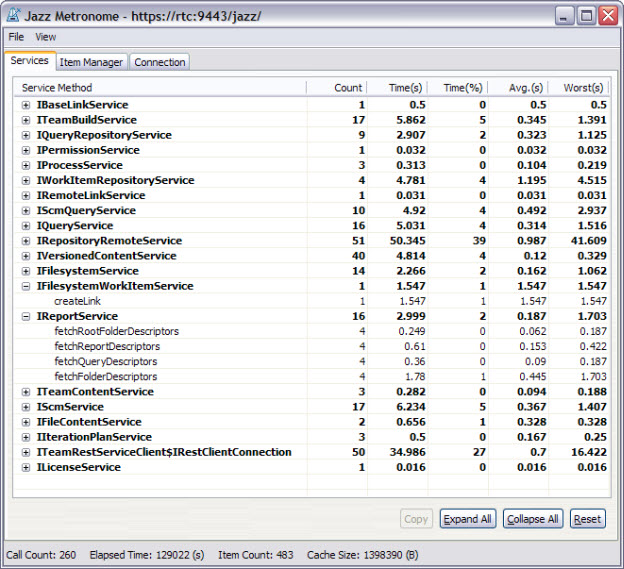
This dialog defaults to the Services tab. As you can see, it’s possible to get detailed performance data on all of the Jazz-related services that have been invoked, even down to the individual methods for each service.
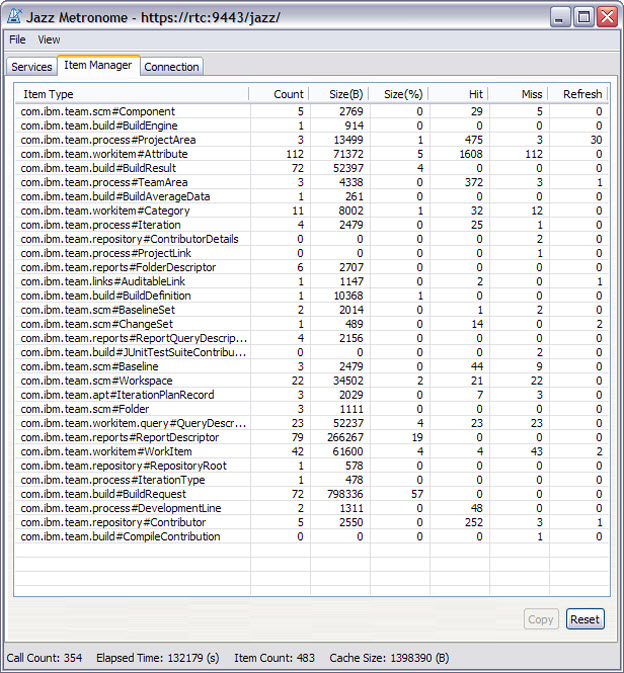
Clicking on the Item Manager tab brings up statistics for this component. The Item Manager is a server-side plug-in that becomes available through the com.ibm.team.interop.service.itemManager extension point. The Item Manager creates Jazz items or updates the properties of Jazz items that have already been created.
Lastly, clicking the Connection tab is very valuable. It allows you to do a “Jazz ping” between your client and the Jazz server. This test first involves 20 “pings,” followed by uploading 2.0MB worth of data to the server, and then receiving 2.0MB of data from the server. The following dialog shows the results of a test from my client:
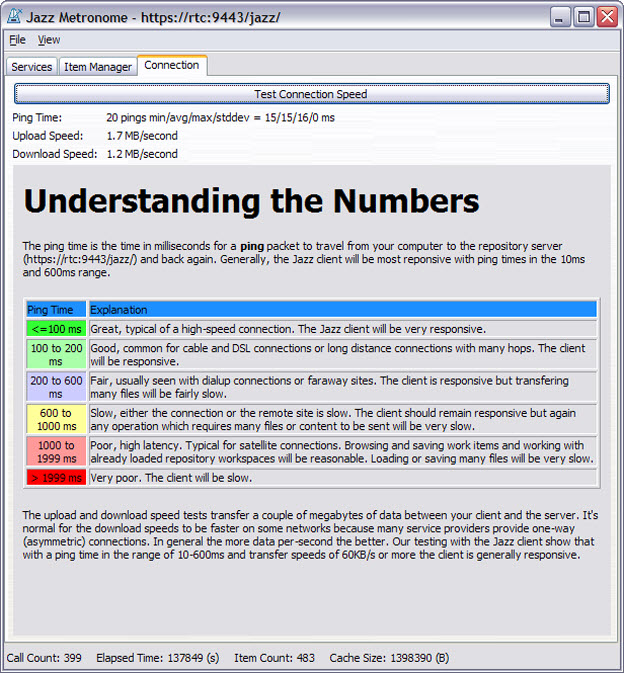
Use the color-coded table to determine what kind of performance you could expect in your client.
For more information
Gary L. Mullen-Schultz is a Certified IT Specialist for IBM. He has extensive experience with System i, Java, the Blue Gene and RoadRunner supercomputer projects, and most recently Rational Team Concert and the other Jazz-based solutions. Gary works for IBM in Minneapolis, Minnesota. He is the state’s biggest Twins fan. Gary can be contacted at garymu@us.ibm.com.
© Copyright 2010 IBM Corporation