Tuning WebSphere servers for Rational Team Concert performance
The purpose of this paper is to step through determining if a WebSphere (WS) server is performing well and how to improve performance if it is not running optimally. It is important that the WS server is tuned correctly or there will be problems when the Rational Team Concert (RTC) server is put under load. In this paper we will show you some common configuration settings that will improve your overall performance and throughput for large loads, based on our experiences in supporting live deployment.
Out of Memory Error!
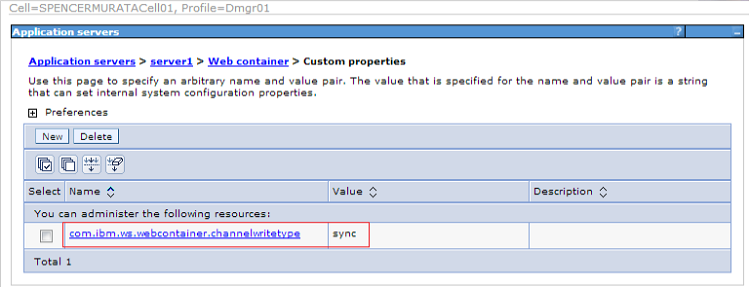
The first general problem that might be encountered is a java.lang.OutOfMemoryError in the WAS logs. The OutOfMemoryError would be encountered on large file transfers, such as when loading a new workspace. However what is strange about this particular instance is that increasing the JVM heap size actually makes the problem worse. This problem is WS attempts an unbounded buffer to load files and will actually cause WS to take all available native memory, not just JVM allocated heap space. So increasing the JVM heap space actually squeezes out the amount of native memory that WS has available to buffer the transfer. The solution here is to change the channel type in WS to use a fixed buffer size instead of the unbounded one to make sure that the native memory does not get exhausted. To do this open the Websphere Application Server (WAS) administration page and go to: Servers -> Server Types -> WebSphere application server -> [Server Name] -> Container Settings -> Web Container Settings -> Web Container -> Custom Properties. Then create an new property: com.ibm.ws.webcontainer.channelwritetype and set it equal to sync.

The default setting for this property is async. The async value is the default unbounded buffer use to load files. The sync value uses a small, fixed buffer size that will quickly load and empty for large load requests. So by switching to the sync value, the memory utilization will be much lower on large file loads, but there will be a small performance hit as it will have to flush out the buffer much more frequently. However in most enterprise server deployments, this performance hit will not be noticeable.
Hanging threads on Server!
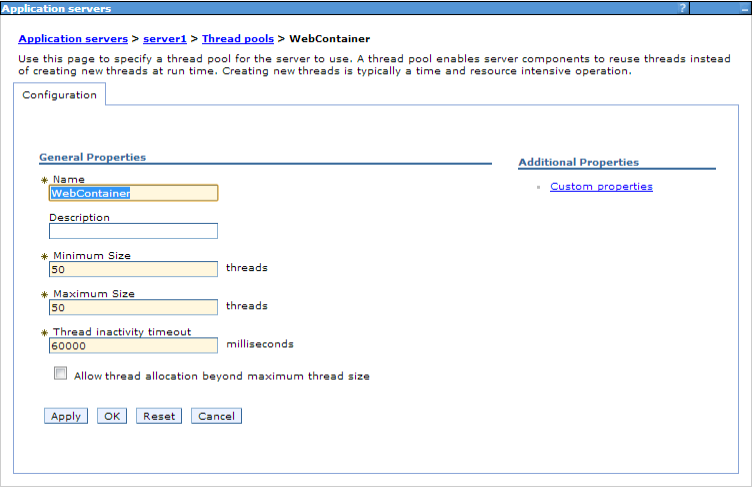
The other problem frequently encountered in WAS/RTC deployments is the WAS thread pool size being of insufficient size to handle the requests coming from RTC. This behavior will manifest with threads appearing as hung and the RTC server appearing to be unresponsive. This is due to thread contention if the thread pool is not properly sized. To determine if the thread pool size is correct for the amount of load on the server, we will need to enable and check the WAS monitoring. First to enable monitoring we need to go to Monitoring and Tuning -> Performance Monitoring Infrastructure (PMI) -> [Server Name] -> Enable Performance Monitoring Infrastructure (PMI) and enable at least Extended monitoring. We need at least enough monitoring to see Thread.ActiveCount and Thread.PoolSize. Once the monitoring is enabled, go to Monitoring and Tuning -> Performance Viewer -> Current activity and select Start Monitoring on [Server Name]. It should be noted that this will increase the load on the server as WAS is now doing additional work to track the activity on the server. Now that the server is actively getting monitored, we need to see what the activity on the threads looks like. From the Monitoring and Tuning -> Performance Viewer -> Current activity -> [Server Name] -> Performance Modules -> Thread Pools and enable logging on WebContainer. Then click on View Modules, and a graph will appear with ActiveCount and PoolSize. To determine if the Thread pool is large enough, we first need to find out what the current thread pool size is. To find this go to Servers -> Server Types -> WebSphere application server -> [Server Name] -> Thread Pools -> WebContainer.


The minimum and maximum size should be the same. There is no hard and firm guidelines on the thread count, but for enterprise deployments we usually recommend 200 and tune from there. Going back to the graph, if the Thread.PoolSize value is equal to the Thread Pool size set on the web container, then there is very likely a problem. The Thread pool size will allocate new threads as they are needed, so they are not allocated at start up, so the thread pool will start low and trend up as threads are allocated. If the PoolSize value on the graph does not equal the web container thread pool size, then everything is fine. WAS did not require the threads so it did not allocate them. However if the values do match, then at some point WAS needed all the available threads to do work. This is probably a bad thing. This means it is very likely that more threads were required but were unavailable causing thread starvation. Check that the ActiveCount is not consistently matching the PoolSize value. If it is not consistently hitting the PoolSize value, then its probably okay. There is spike activity that matches the pool size, but not enough to greatly affect performance. If the ActiveCount and PoolSize graph values do match consistently then there is a problem. The thread pool must be increased to allow more throughput on the server. This is done by bumping up the Web Container thread counts. The maximum and minimum values still should match.
By taking these actions the WAS server should be tuned to have the right number of threads for the server workload, and the channel write type will make sure that the buffer will not overrun the native memory. This should keep the WAS server and RTC deployment running smoothly.
For more information:
About the author
Spencer Murata currently works in the RTC Level 3 Team in Littleton MA. He can be contacted at murata@us.ibm.com.
Copyright © 2013 IBM Corporation