Improve predictability and efficiency with Kanban metrics using IBM Rational Insight
Introduction
This article describes how IBM Rational Insight was leveraged to provide reports with metrics supporting the adoption of the Kanban Method by teams using IBM Rational Team Concert. First we will describe what Kanban is and then present an introduction to Rational Insight. Finally, we will showcase our results through Insight dashboards.
What is Kanban?
Kanban, which means “signal card” in Japanese, is also the name of a visual system used to control the flow of the work in a manufacturing process. It is a pull-based system in which an item is moved from one workstation to the next, only when it is “pulled” by the next workstation, based on a visual sign (Kanban). This approach helps keep inventory costs low and reduces waste in the production process.
More recently, it has been noticed that a Kanban system could also be applied in software development, bringing benefits such as enhanced predictability in the software delivery process and better product quality. David Anderson, a pioneer in adopting Kanban in software development, wrote a book about his experience where he describes “The Kanban Method: an approach to incremental, evolutionary process change for organizations”, in which he defines the following five core practices for Kanban adoption:
- Visualize workflow: the workflow must be visible to the team so that everyone can see incoming requests, the backlog and the flow phases (so they can identify opportunities of improvement in the flow). In Figure 1, you can see an example of a task board in Rational Team Concert that helps teams that are adopting Kanban to visualize the workflow.
- Limit the work-in-progress (WIP): the amount of concurrent work being done should be limited in each stage of the flow. According to “Little’s Law”, there is a linear relationship between the amount of work in progress and the lead time, that is, the period between the moment the work arrived to the moment it was delivered. This indicates that the lower the WIP, the better. In addition to this, limiting the WIP helps keep the work flowing smoothly so that teams can benefit from a healthy work-life balance. This results in increased motivation and higher quality software.
- Measure and Manage flow: it is important that teams measure the flow to monitor the impact, positive or negative, of the actions implemented to improve the workflow, such as new WIP limits. Here, the usage of an electronic tool to support measurement, such as Rational Insight, plays a significant role.
- Make management policies explicit: often the policies adopted in software development projects are not explicit. They may be documented in a process description that few know about it or are known only in the mind of some team members. However, it is important that the policies be explicit so that their value and applicability can be discussed by everyone on the team.
- Improve collaboratively (using models and the scientific method): it is necessary that teams collectively reflect and discuss the workflow and usage models, like Lean and Theory of Constraints (TOC), to recommend actions that lead to process evolution.

IBM Rational Insight
IBM Rational Insight is Rational’s performance measurement offering. It is an enterprise reporting solution that gets consistent metrics from across an organization to objectively measure status and progress. It allows companies to measure program, project and team-level progress against pre-defined business objectives. Insight provides this intelligence through reports and dashboards that are viewable via various channels such as web browsers, iPads and mobile phones.
Insight connects to various data sources and allows the creation of create custom reports containing elements such as scorecards, geographic maps, heat maps and bubble charts. It has its own data warehouse that allows for collection of historical data to be able to identify trends. Insight also comes bundled with various pieces of collateral that include pre-defined ETL builds, Framework models, a data warehouse schema and several report/dashboard designs.

Kanban Metrics and Results
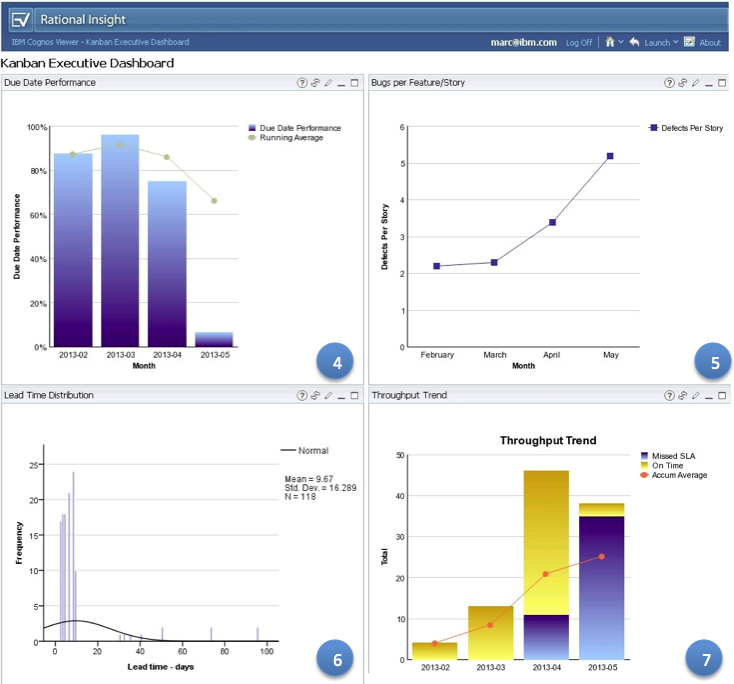
Now we will introduce the set of reports and dashboards that were built using IBM Rational Insight to help teams adopt the Kanban core practices. This is based on data that was extracted from IBM Rational Team Concert. Figures 4 and 5 below show the dashboards with seven reports that we will focus on.
- Cumulative Flow Diagram
This report shows the relative amount of work for each stage of the workflow over time. The colored areas in the diagram represent work in progress for each stage of a process. The Cumulative Flow Diagram (CFD) as shown in Figure 3, presents three important data points:- The vertical distance between each area represents the amount of work in progress on the respective stage in a specific date
- The horizontal distance between the areas in the chart corresponds to the average lead time of the requests that arrived on a specific date
- The mean delivery rate, represented by the slope of the closed items area, corresponds to the trend in the delivery of the work (the triangle in the chart provides a visual representation of “Little’s Law”)
Figure 3 – Cumulative Flow Diagram AnalysisThis chart can be used to identify bottlenecks and variability points in the flow. A “healthy” flow of a system with good predictability should have a Cumulative Flow Diagram with areas of low variability across the x-axis. The CFD chart shown in the dashboard of Figure 4, for example, indicates that after 05/19/2013, the number of WIP is growing in the Design phase. This is a hint that there may be a problem in the following phase, the Coding phase.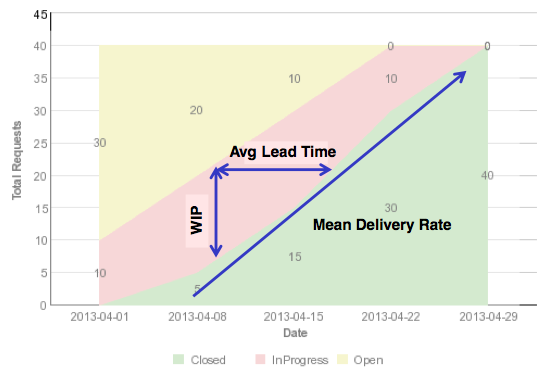
- Lead Time Average
This report shows a trend of the average number of days a task took to be completed, from start to finish. It is categorized by work item type so teams can see the how the system is performing over time, broken down by work item type.
- Flow Efficiency
This report shows the average percentage of lead time that a developer spent working on a task (touch time). This shows the potential for process improvements.
Figure 4 – Kanban Dashboard 1
- Due Date Performance
This report shows the percentage of items that were delivered on time and the average percentage delivery rate over time. This is useful for illustrating how predictable the system is. Due date performance with a low percentage provides evidence that there is an abundance of variability in the flow. The team should take corrective action or they will not be able to establish reasonable service agreements.
- Bugs per Story
This report shows a trend of the average number of defects opened against a Story. Attaining predictability is a fundamental aspect in the Kanban system, however, that will be ineffective if the software is delivered with low quality. This chart is also useful when implementing Kanban to help teams establish goals in the quality area.
- Lead Time Distribution
This report is a statistical distribution that shows the number of occurrences by lead time. It is an effective way to identify discrepancies in the process and boosts the confidence of teams in the definition of service level agreements, based on real life data.
- Throughput Trend
This report shows the number of items that were delivered in a given time period (eg monthly). It can be used to identify a trend of how well the system has been performing. As teams work on process improvements, the throughput trend will show a more consistent slope in the chart.
Figure 5 – Kanban Dashboard 2