IBM SmartCloud APM Integration with IBM SmartCloud Continuous Delivery
Introduction
IBM SmartCloud Continuous Delivery (SCD) 2.0 is the first offering from IBM to address the enterprise DevOps space. SCD can generate a delivery pipeline that helps customers automate deployments as development changes are made. SCD 2.0 brings with it an important integration with performance management tools. This article discusses integration with IBM SmartCloud Application Performance Management (APM).
Let us examine the need for integration with a performance management tool. The primary driver for SCD is to deliver quality software in challenging time schedules as demanded by today’s business. A critical part of software quality is ability for the software to perform well against different load conditions. Therefore, as we build code, we must test and measure performance early in the development process to allow time to test under different conditions and to correct problems. IBM SCD integration with SmartCloud APM solves this problem by adding performance measurement to the automated flow. In this way, the build process constantly tests the performance of the software.
SCD also standardizes performance management tools over different environments. In many real-life situations, the tools used in development work are different from the tools used in the production environment. This difference can make it difficult to translate problems found in production into development solutions. SCD solves this problem by using the same performance management tools on all environments.
Prerequisites
Of course, the integration requires a complete installation of IBM SmartCloud Continuous Delivery, including a library server, cloud host, and an installation of Rational Team Concert. You must also have an SCD continuous delivery build for your application. This continuous delivery build must use Ruby Rake, rather than Apache Ant. The extensions that enable performance monitoring support only Rake. For installation instructions and information about continuous delivery builds, see the links in the References section.
SCD integration with APM also requires the following components:- These components must be running on the cloud host or on physical servers:
- IBM Tivoli Enterprise Monitoring Server – The hostname, user ID and password for logging into this server is needed to set up configuration files that enable performance management integration.
- IBM Tivoli Enterprise Portal Server
- IBM Tivoli Data Warehouse
- IBM Tivoli Summarization and Pruning Agent
- IBM Tivoli Warehouse Proxy Agent
- The virtual system pattern for the application must include the APM script packages for IBM Tivoli Monitoring Linux OS Agent or the IBM Tivoli Composite Application Manager Agent for WebSphere Applications, as appropriate. If you are adding performance monitoring to an existing build, you must re-import the pattern and update the Weaver infrastructure definition and façade files to include the new script packages.
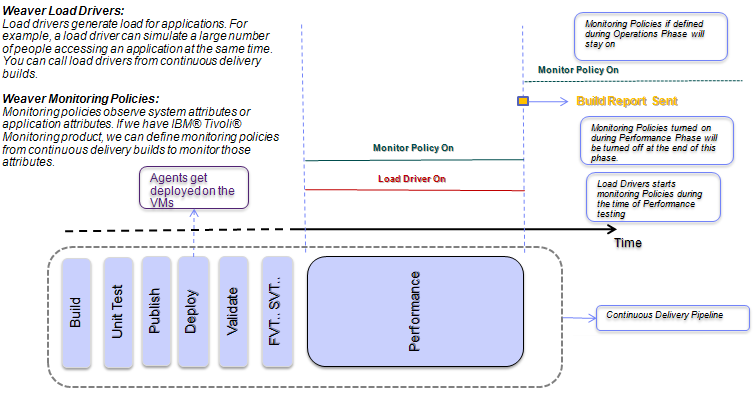
- Load drivers and monitoring policies must be set up. Load drivers generate load for applications. For example, a load driver can simulate a large number of people accessing an application at the same time. Monitoring policies observe system attributes or application attributes, such as the amount of memory in use. If we have IBM Tivoli monitoring software, we can define monitoring policies in continuous delivery builds to monitor those attributes. Let us look at this item in detail in the next section.
Phases in the delivery pipeline
Normally, the delivery pipeline or automation sequence includes the following phases:
- Building the application binaries
- Unit testing the application binaries
- Packaging and publishing the application and the infrastructure to the library server
- Deploying the application on the cloud
- Validating the deployment
- Running automated tests through Rational Quality Manager integration, Cucumber, or other test frameworks
- Performance testing
- Operations
The last two phases (7 and 8) are added for APM integration. You can include either or both of these phases
During the performance testing phase, load drivers generate synthetic load. Monitoring policies can be specified in conjunction with load drivers. These monitoring policies run during the performance testing phase and stop when the corresponding load driver terminates. Additionally, you can specify assertions on the data that the load drivers return. These assertions are evaluated when the test is finished, and the evaluation results are shown as part of the Rational Team Concert build. ITM monitoring policies may specify conditions which are evaluated as per the sampling schedule set. If ITM policies are active in combination with a load driver, as in the current context, the policies that are triggered are logged and published as a log file inside the RTC build.
During the operations phase, monitoring policies may run independently of load drivers. These monitoring policies run at the beginning of the operations phase and remain active through the lifetime of the deployed system unless they are stopped manually. The results of these policies are not reported into the RTC build logs because the build cycle ends at the performance phase. However, policy violations in the operations phase appear on the IBM Tivoli Enterprise Portal Server.
The following diagram illustrates the phases of a continuous delivery build that includes the performance testing and operations phases:
Continous Delivery Timeline – Performance Phase
Implementation
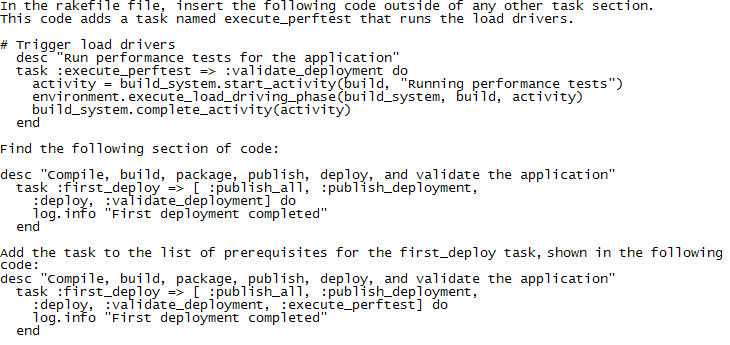
Follow these steps to use load drivers and monitoring policies in continuous delivery builds:
- In Weaver files, create one or more load driver definitions to relate to the load drivers you have created. These definitions can go in existing files or new files. The following code shows a simple example of a load driver definition that verifies the server’s response time and error rate:
File Name: ../definitions/policies/policies.weaver load_driver(:jke_load_testing) { description 'SLAs on Synthetic Load Verification' assert "avg response time less than 1 seconds" do |data| data.response_time_avg < 1000 end assert "maximum 5% server request errors" do |data| data.error_rate < 0.05 end } - In your Weaver environment definition file, import the files that contain the load driver definitions
- In the environment definition file, assign the load drivers to one or more components of the application, as in the following example code. Notice that the definition of the load driver (and monitoring policies) can be extended as well as overridden.
File Name: ../definitions/policies/policy_testing.weaver import "../policies/policies.weaver" jke.app_srv.jke_app.load_driver(:jke_load_testing) { driver_hostname 'test.zurich.ibm.com' driver_username 'devops' driver_password 'dev12ops' driver_command late_binding { "jmeter/bin/run-jmeter" } remote_data_dir "jmeter" end } - In the rakefile file, call the load drivers, as shown in the following code examples.
- In a Weaver file, create one or more monitoring policy definitions. These definitions can go in existing files or new files. The following Weaver code is an example of a monitoring policy definition.
itm_policy(:cpu_check) { description "ITM test policy" #TEMS Server Name server "loadtester.mycompany.com" username "sysadmin" password "sysadmin" agent "LZ" condition "*IF *VALUE KLZ_CPU.User_CPU *GT 20.00 *AND *VALUE KLZ_CPU.CPU_ID *EQ Aggregate" sampling_rate "000030" force true } - In the environment definition file, import the files that contain the monitoring policy definitions.
- In the environment definition file, assign the monitoring policies to one or more components of the application. As explained earlier, monitoring policies can be specified in conjunction with load drivers and the following code example shows how this is done.
File Name: ../definitions/policies/policy_testing.weaver import "../policies/policies.weaver" type (:itm_policy) { description 'ITM test policy' username 'sysadmin' # ZRL's TEMS server server '9.4.21.179' password 'sysadmin' } jke.app_srv.jke_app.load_driver(:jke_load_testing) { driver_hostname 'test.zurich.ibm.com' driver_username 'devops' driver_password 'dev12ops' driver_command late_binding { "jmeter/bin/run-jmeter" } remote_data_dir "jmeter" end # Some policies that monitor what's happening during load driving itm_policy(:linux_cpu_check) { description 'ITM test policy' agent 'LZ' severity '' condition '*IF *VALUE Linux_CPU.User_CPU *GT 20.00 *AND *VALUE Linux_CPU.CPU_ID *EQ Aggregate' sampling_rate '000030' force true } itm_policy(:klz_cpu_check) { description 'ITM test policy' agent 'LZ' severity '' condition '*IF *VALUE KLZ_CPU.User_CPU *GT 20.00 *AND *VALUE KLZ_CPU.CPU_ID *EQ Aggregate' sampling_rate '000030' force true } }For the sake of completeness, here is an example of a monitoring policy by itself directly assigned to a node in the same file defined later
File Name: ../definitions/policies/policy_testing.weaver import "../policies/policies.weaver" # ITM Monitoring Policy being added during Operations Phase. jke.app_srv.jke_app.use(:cpu_check) { } And in the File Name: ../policies/policies.weaver itm_policy(:cpu_check) { description "ITM test policy" server "9.42.76.141" username "sysadmin" password "zhu88jie" agent "LZ" condition "*IF *VALUE Linux_CPU.CPU_ID *EQ Aggregate *AND *VALUE Linux_CPU.System_CPU *NE 1.00" sampling_rate "000030" force true } - In the rakefile file, call the monitoring policies if they are to be run as a part of the Operations phase. Otherwise, they are registered when the load drivers are added to the rakefile as shown above.
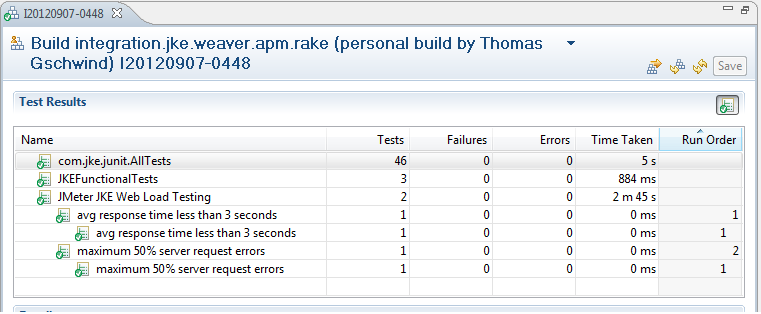
The results of the load drivers appear on the Tests tab of the build results. The results of the monitoring policies appear on the Logs tab after continuous delivery build runs. The following screencapture shows how the results of a load driver are integrated into the build results shown by RTC. Here we see the result of the load driver :jke_load_testing that was defined above. Each assertion is shown as a separate test.
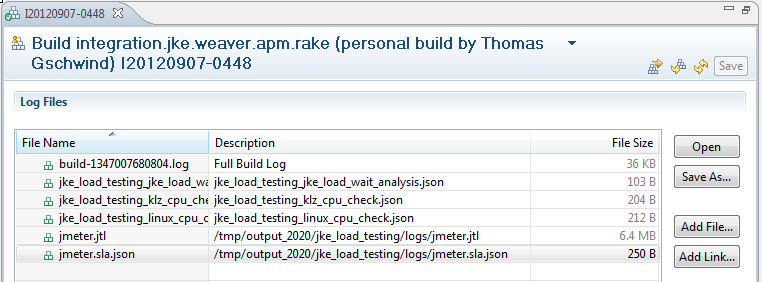
The log files created during the performance execution phase are posted as part of the logs section of the build result. The sample load driver that we created (to use jmeter) created the following log files:
- jmeter.jtl (the log file created by jmeter)
- jmeter.sla.json (performance data that a script part of our load driving infrastructure has extracted from the jmeter results).
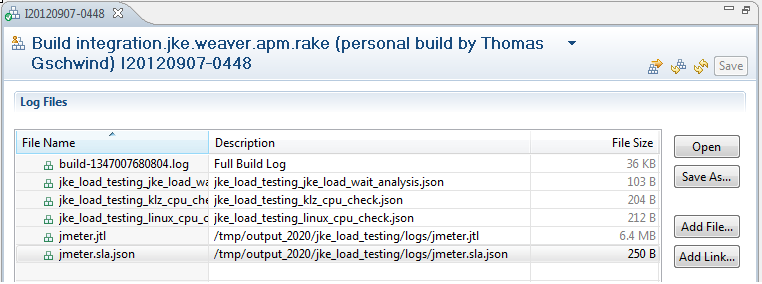
The results of ITM policy triggers are shown in the logs section of build result. In the screenshot below, we see two ITM policies that have triggered that were associated with load driver. These policies are :klz_cpu_check and :linux_cpu_check.
As mentioned earlier, only policies that trigger as part of a load driver can be displayed as part of the RTC build result.
ITM background
This section provides a brief summary of the workings of IBM Tivoli monitoring infrastructure and how it interacts with SCD.
APM provides script packages for IBM Tivoli Monitoring Linux OS Agent and the IBM Tivoli Composite Application Manager Agent for WebSphere Applications. You must add these script packages to the Virtual System Pattern (VSP) for the application. To add these packages, open the VSP for editing in the IBM Workload Deployer web client and drag and drop the appropriate script packages to the pattern. These work with:
- ITCAM Agent for WebSphere Applications Version 7.2.x
- IBM Tivoli Monitoring: Linux OS Agent Version 6.2.3.x
The installation images for the agents must be licensed and downloaded separately and made available to the script package as a Network File Server (NFS) mount.
During the deployment phase, after the VMs are provisioned, the APM script packages for IBM Tivoli Monitoring Linux OS Agent and/or the IBM Tivoli Composite Application Manager Agent for WebSphere Applications run. These scripts install the appropriate IBM Tivoli Monitoring agent on the VMs and configure them to point to the Tivoli Enterprise Monitoring Server or the Remote Tivoli Monitoring Servers (RTEMS). Internally, a script runs to find and connect to the RTEMS that is the least loaded. Then, the agents run with the default situations. However, with SCD and Weaver, the user can create additional situations during the performance testing and operations phases programmatically.
At the start of the performance testing phase and the operations phase, the ITM monitoring policy runs the tacmd command on the target node to create the testing situation. At the end of the performance testing phase, it runs the command again to delete the situation. If the situation is part of the operations phase, it keeps running until you stop it manually. In all cases, no matter how the ITM policies are triggered, you can view the situations in the IBM Tivoli Enterprise Portal Server.
Weaver language constructs
Load drivers
Load drivers generate synthetic load for a component of an application. Load drivers are specified using the load_driver statement in the Weaver language. This statement executes a command on a particular load driver host. The load_driver statement itself is generic and allows any script to be executed on any machine. The command specifies a shell script that runs the concrete load driver application. The load driver host may be an existing external machine or a virtual machine that is started as part of the weaver infrastructure definition. A load_driver statement may be specified for any component (such as an application on a VM) in a Weaver file.
The general syntax for a load_driver statement is as follows:
load_driver(:driverName) { attributes assertions } The assertions in the load_driver statement verify the performance of the application under the synthetic load. For example, the following code verifies that the average response time is less than 3 seconds and that the server request error rate is less than 50%:
assert "avg response time less than 3 seconds" do |data| data.response_time_avg < 3000 end assert "maximum 50% server request errors" do |data| data.error_rate < 0.5 end
The attributes in the load_driver statement use the following syntax:
attributeName "attributeValue"The load_driver statement accepts the following attributes:
| description: | An optional description. |
| driver_hostname: | The load driver host name or IP address. This attribute is mandatory. |
| driver_username: | A valid ssh user id on the load driver host. This attribute is mandatory. |
| driver_password: | The password for the given ssh user. This attribute is mandatory. |
| driver_command: | The script to run on the load driver host. Unless fully qualified, the path is interpreted relative to the home directory of the user. This attribute is mandatory. The command string can contain arbitrary parameters. For specifying application-specific parameters the following symbols exist: driver – Attribute collection of the containing load driver component – Attribute collection of the containing component node – Attribute collection of the containing node |
| remote_data_dir: | The directory in which the load driver stores results. Data from here is stored at various different places within the RTC build. |
The load driver can generate multiple different data files. These files must be stored in the directory specified by the remote_directory attribute. The structure of this directory is as follows:
- <remote_data_dir>/output/<load_driver_id>/logs: Each file stored in this directory is posted in the RTC build result as a log file. One log file may have a .sla.json extension; this file contains the data to evaluate the assertions of the load driver. The result of these assertions is posted as a JUnit test in the RTC build result.
- <remote_data_dir>/output/<load_driver_id>/links: Each file in this directory may contain a link which is posted as an external link in the RTC build result. The name of the file is used as the name of the link.
- <remote_data_dir>/output/<load_driver_id>/tests: Each file in this directory is treated as a JUnit XML file containing a JUnit test result. These tests are posted in the test section of the RTC build result.
If a load driver returns data (contained in the .sla.json file in the logs directory), you can evaluate this data with assertions in the load driver. In general, an assertion statement is a condition that represents a particular service level. If the condition is violated, the build fails and an indication is given in the JUnit test section of the build result.
A sample load driver specification is given below:
load_driver(:jke_load_testing) { description 'SLAs on Synthetic Load Verification' driver_hostname 'test.zurich.ibm.com' driver_username 'devops' driver_password 'dev12ops' driver_command 'jmeter/bin/run-jmeter' remote_data_dir "jmeter" assert "avg response time less than 3 seconds" do |data| data.response_time_avg < 3000 end assert "maximum 50% server request errors" do |data| data.error_rate < 0.5 end } In the above example, the driver_command ‘jmeter/bin/run-jmeter’ implies that a script called run-jmeter script is located at /home/devops/jmeter/bin. This is a shell script that confirms to the load driver rules and also starts the actual jmeter tool. This points to the location of jmeter.jmx, runs the jmeter tool, sets up the directory structure – /home/devops/jmeter/output/<load_driver_id>/logs – and directs the log outputs to be written there.
A load driver may also return data as a JSON attribute collection. This collection is represented as a Ruby compound and is bound to the placeholder <compound>. Within an assertion statement, these values can be accessed with the code <compound>.<attribute_name>.
The attribute collection is generated by the load driver and passed back as a JSON file. This JSON file must have the correct data attributes. Below is a sample JSON file generated by a JMeter load driver:
{ "response_time_min": 116.000, "response_time_max": 6745.000, "response_time_avg": 488.456, "response_time_std": 345.388, "response_time_med": 432.000, "error_rate": 0.020, "response_200": 10048, "response_503": 203 } ITM Policies
IBM Tivoli Monitoring (ITM) monitoring policies are specified with an itm_policy statement. You can specify an itm_policy statement for a Weaver node (representing a particular VM) or for a component within a node (representing a particular application on the node).
You can also specify ITM monitoring policies within a load_driver statement. In this case, the policy is activated during the performance testing phase along with the containing load driver. Policies that are not specified as part of a load driver statement run during the operations phase.
The general syntax for this statement is as follows:
itm_policy(:policyName) { attributes } ITM policy statements may have the following attributes: | description: | An optional description. |
| server: | Host name or IP address of the IBM Tivoli Enterprise Monitoring Server (TEMS). This attribute is mandatory. |
| username: | The ID of the TEMS admin user. This attribute is mandatory. |
| password: | The password of the TEMS admin user. This attribute is mandatory. |
| agent: | The agent that is to execute the situation. This attribute is mandatory. Because currently only the ITM Linux monitoring agent is supported, the only valid attribute value is ‘LZ’. |
| condition: | An IBM Tivoli Monitoring condition formula. If this condition is met, the situation is triggered and the action in the action parameter runs. Weaver does not verify this condition formula before passing it to the server, so you must make sure that the formula is valid. This attribute is optional if the situation is already defined. If this attribute is not specified, the force attribute is automatically set to true, which causes the situation to start with an unchanged condition value. |
| sampling_rate: | The sampling interval of the ITM situation given as ‘hhmmss’. The lowest possible value 30 seconds (‘000030’). ITM automatically resets lower values to this minimum. |
| action: | A system command to run when the situation triggers. This attribute may be specified only for ITM policies in the operations phase. It is ignored for ITM policies specified within a load driver. |
| severity: | Optional alert message severity for TEP. Valid values are ‘Fatal’, ‘Critical’, ‘Minor’, ‘Warning’, ‘Harmless’, ‘Informational’, and ‘Unknown’. The default value is ‘Critical’. |
| force: | The Boolean value ‘true’ indicates that an existing ITM situation will be overwritten with the policy attributes. If this attribute is not specified or has any value other than ‘true’, attempting to overwrite an existing ITM policy will fail. |
A sample ITM policy is shown below.
itm_policy(:klz_cpu_check) { description 'ITM test policy' server 'load-driver-host.my-domain.com' username 'devops' password '********' agent 'LZ' condition '*IF *VALUE KLZ_CPU.User_CPU *GT 20.00 *AND *VALUE KLZ_CPU.CPU_ID *EQ Aggregate' sampling_rate '000030' force true } For more information
About the authors
Joydeep Banerjee is a Senior Software Engineer at the IBM Tivoli software in Los Angeles, Calfornia. He works on designing and developing Application Performance Management (APM) solutions and was the lead from Tivoli team to work on IBM SmartCloud Continuous Delivery and APM integration. His other interests include Data Warehousing, Business Intelligence and Data Analytics. Contact Joydeep at jbanerje@us.ibm.com
Thomas Gschwind is Research Staff Member at the IBM Zurich Research Laboratory, Switzerland and lecturer at the University of Zurich. His research interests are cloud computing (DevOps and provisioning), programming languages, and software engineering. Thomas was lead architect of the monitoring and load driving subsystem of IBM’s SmartCloud Continuous Delivery project and earlier for the Process Model Accelerators for IBM’s WebSphere Business Modeler. Thomas is a Senior Member of the IEEE and holds degress from Technische Universitaet Wien (MS, 1997; PhD, 2002). Contact Thomas at thg@zurich.ibm.com
Tim McMackin is a technical writer for IBM Rational software in Durham, North Carolina. His main work is with IBM SmartCloud Continuous Delivery and he has been with IBM since 2004. Contact Tim at tmcmack@us.ibm.com
Andreas Schade is a researcher at the IBM Zurich Research Laboratory, Switzerland, where he currently works in the Process Management Technologies Group. At IBM he has worked on pervasive computing and e-business systems, as well as distributed systems and applications and their management. He holds a diploma degree (Dipl.-Inf., 1994) and a doctoral degree (Dr. rer. nat., 1998) in computer science both from Humboldt-University Berlin, Germany. Contact Andreas at san@zurich.ibm.com
Copyright © 2013 IBM Corporation