Sizing and tuning guide for Rational DOORS Next Generation 6.0: configuration management 
Authors: VaughnRokosz, GustafSvensson, LeeByrnesBuild basis: IBM Rational DOORS Next Generation 6.0
- Introduction
- How hardware configurations impact scalability
- How artifact counts impact configuration management operations
- Appendix A: Topology
- Appendix B: Tested hardware and software configurations
- Appendix C: Test data shape and volume
- Appendix D: Workload characterization
- Appendix E: Server tuning
- Appendix F: Database server hardware
- Appendix G: Proxy server hardware and configuration (for repositories of all sizes)
- Appendix H: Server performance benchmarks
- Using the CPU workload: sysbench --test=cpu --cpu-max-prime=20000 --num-threads=2 run
- Using the threads workload: sysbench --test=threads --thread-locks=1 --max-time=20s run
- Using the mutex workload: sysbench --test=mutex --num-threads=64 run
- Using the memory workload: sysbench --test=memory --num-threads=4 run
- Appendix I: Hard disk performance benchmarks
Introduction
The 6.0 release of IBM® Rational® DOORS® Next Generation (RDNG) introduces a major new feature: configuration management. You can now manage the evolution of requirements using techniques similar to those which Rational Team Concert supports for managing source code. You can organize requirements into streams and baselines, and you can make changes to requirements within the context of change sets which can then be delivered to streams. You can easily reuse requirements by branching streams or baselines, and you can apply versioning across your entire CLM solution through global configurations. This 6.0 sizing guide focuses on the new configuration management feature, and examines the impact of different hardware configurations on the scalability of a deployment (where scalability refers to the maximum throughput/user load which can be achieved for a given repository size without significant response degradation). This guide also looks at the impact of artifact counts on the configuration management operations. If you are not using configuration management, please refer to Sizing and tuning guide for Rational DOORS Next Generation 5.0. The sizing recommendations for 6.0 without configuration management are the same as for 5.0.Standard disclaimer
The information in this document is distributed AS IS. The use of this information or the implementation of any of these techniques is a customer responsibility and depends on the customer's ability to evaluate and integrate them into the customer's operational environment. While each item may have been reviewed by IBM for accuracy in a specific situation, there is no guarantee that the same or similar results will be obtained elsewhere. Customers attempting to adapt these techniques to their own environments do so at their own risk. Any pointers in this publication to external Web sites are provided for convenience only and do not in any manner serve as an endorsement of these Web sites. Any performance data contained in this document was determined in a controlled environment, and therefore, the results that may be obtained in other operating environments may vary significantly. Users of this document should verify the applicable data for their specific environment. Performance is based on measurements and projections using standard IBM benchmarks in a controlled environment. The actual throughput or performance that any user will experience will vary depending upon many factors, including considerations such as the number of other applications running in the customer environment, the I/O configuration, the storage configuration, and the workload processed. Therefore, no assurance can be given that an individual user will achieve results similar to those stated here. This testing was done as a way to compare and characterize the differences in performance between different configurations of the 6.0 product. The results shown here should thus be looked at as a comparison of the contrasting performance between different configurations, and not as an absolute benchmark of performance.How hardware configurations impact scalability
We conducted a series of tests with different hardware configurations, to assess the impact of memory and disk drives on scalability. These tests cover similar configurations as in the 5.0 sizing guide, but the workload used for 6.0 included configuration management operations. We carried out these tests by setting up a specific hardware configuration and repository size, and then slowly increasing the number of simulated users until we started to see increasing response times. The overall conclusions for 6.0 are similar to the 5.0 conclusions. As a general rule, the system can support more users (and more artifacts) as the amount of RAM on the DNG server increases. The number of supported users can also be increased if the disk I/O speed is increased (e.g. by using SSD drives instead of regular hard disks). The reason for this concerns the index files used by the DNG server to provide fast access to artifact data. The DNG server will cache this index in memory if possible, which is why increasing the amount of RAM can improve performance. The amount of RAM available to cache the DNG index is roughly the total amount of RAM minus the maximum size of the JVM heap. If the disk size of the DNG index (in server/conf/rm/indices) is less than that number, then the DNG index will be cached in memory, which will allow for the fastest read access to DNG data. The DNG index will be accessed from the file system when there isn't enough memory to cache the index completely (but also on write operations). This is why disk I/O matters, and why an SSD drive (when combined with enough RAM) provides the best performance and scale.A note on failure modes
What we see in all cases is that the response times slowly increase as the user load increases up to a point - and at that point, there is a sudden, sharp increase in response times. At the same time, the CPU utilization on the DNG server increases to 100%. This is the classic symptom of lock contention in Java. As the load increases, the simulated users start to ask for exclusive access to the same data, and this causes a queue to form. The bottleneck forms around access to the DNG index information. We have observed that the user load at which this happens is not consistent, and so there is a margin of error on the user estimates of +/- 50-100 users. This failure mode is in part a consequence of the performance simulation itself, which issues a stream of requests against the server at a steady rate, without pause. Our simulated users never take breaks for coffee, or go to meetings, or go to lunch! This represents a worst case scenario, where the server can never catch up. In production usage, it would be common for bursts of operations to be followed by slow periods, during which the server can catch up.Tuning recommendations for all configurations
JVM nursery sizing: 1/3 of max JVM heap
When allocating memory for the Java Virtual machine for the DNG server, allocate 1/3 of the total heap to the nursery (divide the value of -Xmx by 3, and use that for -Xmn). The nursery is a section of JVM memory used to efficiently manage short-lived objects, such as those associated with handling an incoming HTTP request. As the number of concurrent DNG users grows, there is more demand on the nursery to process the incoming transactions. If the nursery is too small, memory for those objects will be copied into sections of JVM memory which have more management overhead. By allocating more memory to the nursery, you can improve performance at higher load levels by ensuring that short-lived objects stay in the nursery.Tuning the configuration management cache
Some information about streams and baselines is cached in memory. The cache size can be changed to improve the performance for higher user loads (with the tradeoff being additional memory usage). You control the cache settings through JVM startup parameters (e.g. through the -D flag or by using custom JVM properties). The cache stores information which DNG associates with each configuration (where a configuration is a stream, baseline, or change set). For best performance, set the cache size to the number of concurrent users. This supports the worst-case scenario where all active users are working in separate configurations. The default value for this cache is 200. To set as a JVM startup parameter:-Dcom.ibm.rdm.configcache.size=400Assume that each active entry in the cache will consume 2M of RAM.
Keeping database statistics up-to-date
Information about streams, baselines, and changesets is stored in tables in the database. The DNG server will query these tables when users work in a DNG project which is enabled for configuration management. For best performance, be sure that the database statistics are kept up to date as the size of the repository grows. This is especially critical when you are first adopting configuration management. Some of the tables will start out empty, and then grow as users work with streams, baselines, and change sets. Keeping the database statistics updated ensures that the queries against those tables will be properly optimized. Databases generally manage statistics automatically; for example, in a scheduled overnight operation. However, to ensure that the database is fully optimized, you can manually run the statistics as follows. DB2DB2 REORGCHK UPDATE STATISTICS ON TABLE ALLOracle
EXEC DBMS_STATS.gather_schema_stats(' JAZZDBUSER' );
Available TCP/IP ports
The default number of TCP/IP ports that are available on AIX and Linux operating systems is too low and must be increased. Windows operating systems have a higher default limit, but that limit might still be too low for large concurrent user loads. Use the following instructions to increase the port range.- On AIX and Linux systems, set the limit as follows: ulimit -n 65000
- On Windows 2003 Server, follow these steps:
- Open the registry.
- Navigate to HKEY_LOCAL_MACHINE/SYSTEM/CurrentControlSet/Services/Tcpip/Parameters and create a dWord named MaxUserPort. Set its value to 65000.
- Restart the computer.
- On Windows 2008 Server, follow the instructions in this Microsoft support article to change the dynamic port range. For the start port setting, use 2000. Set the number of ports to 63535.
Thread pool size
The WebSphere Application Server thread pool size must be increased from the default of 50 to 0.75 times the expected user load. For example, if you have 400 concurrent users, the thread pool maximum should be set to 300.More suggestions
In a 3-server topology, where Jazz Team Server and the DNG server are on separate hardware, adjust two settings in the fronting.properties file for loads higher than 200 concurrent users.- Ensure that com.ibm.rdm.fronting.server.connection.route.max equals the number of users
- Ensure that com.ibm.rdm.fronting.server.connection.max is twice the value of number of users
Repositories with up to 500,000 artifacts
The chart below summarizes the results of testing with a repository of 500,000 artifacts, using a standard configuration management workload. Here we looked at the impact of the amount of RAM on the response times and maximum user limit. The system with 32G RAM performed the worst. Given that the 500K repository has a 39G index, and our 32G system has only 16G or less available for caching, this is not unexpected. Increasing the amount of RAM to 64G allows for most of the index to be cached in memory. Performance for both the 64G and 128G systems are roughly the same, as is the supported user load (around 450). The maximum user load for the 64G system was unexpectedly high (600 users vs. 450 for 128G). This is related to the inconsistencies discussed earlier regarding the exact point at which bottleneck around the DNG index forms. We therefore use 450 users as the limit for the 64G system, to be conservative.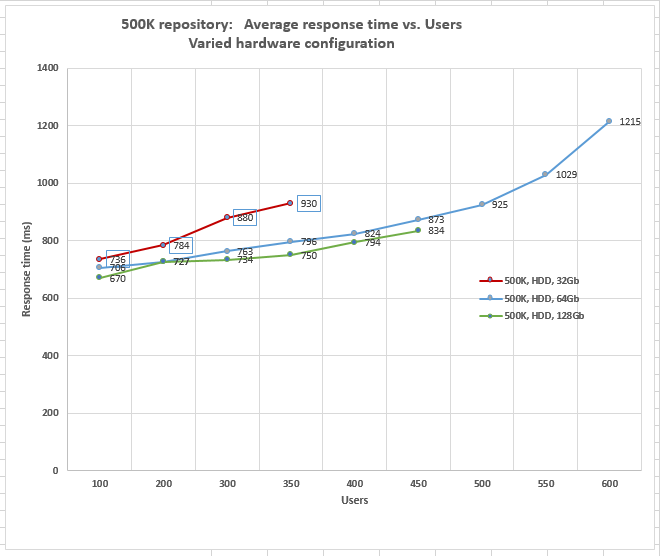 Note: in this graph, we have left out the data points collected when the system was overloaded. The line for the 32G system, for example, stops at 350 users. If you want to see all of the data points, please refer to the summary table.
The following table shows the various hardware configurations with RAM and heap sizes and the maximum number of concurrent users that are supported in each hardware configuration.
Note: in this graph, we have left out the data points collected when the system was overloaded. The line for the 32G system, for example, stops at 350 users. If you want to see all of the data points, please refer to the summary table.
The following table shows the various hardware configurations with RAM and heap sizes and the maximum number of concurrent users that are supported in each hardware configuration.
|
RM server hardware and JVM configuration |
Jazz Team Server |
DB2 server |
Number of users supported |
|
32 GB RAM with 16 GB JVM heap |
32 GB RAM with 16 GB JVM heap |
64 GB RAM |
350 |
|
64 GB RAM with 24 GB JVM heap |
32 GB RAM with 16 GB JVM heap |
64 GB RAM |
450 |
|
128 GB RAM with 24 GB JVM heap |
32 GB RAM with 16 GB JVM heap |
64 GB RAM |
450 |
Repositories with up to 1M artifacts
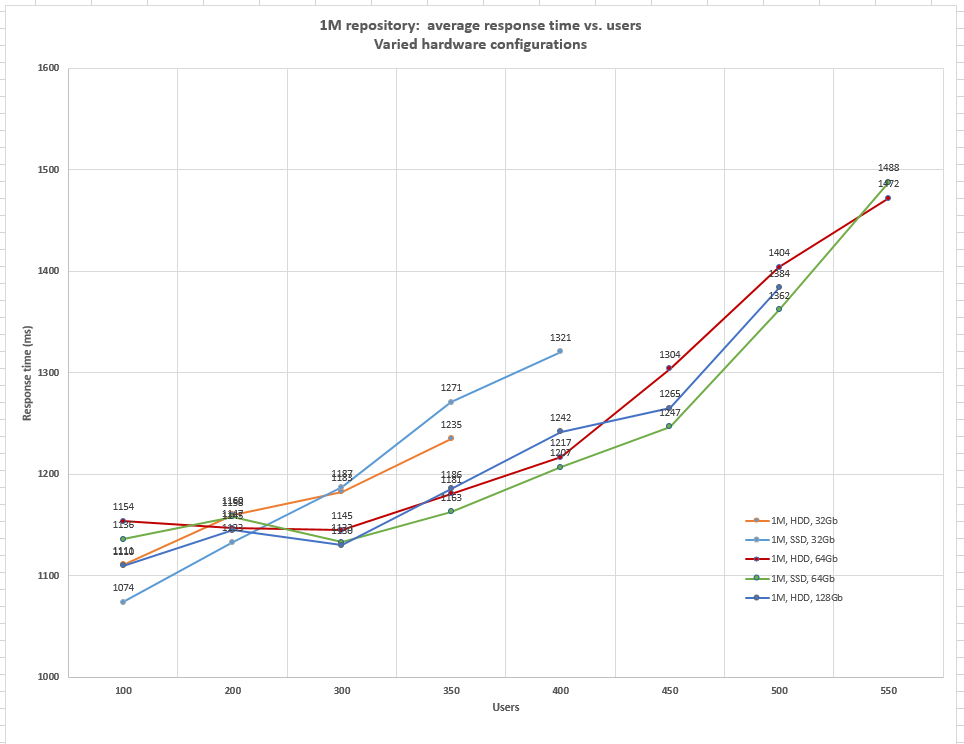
The chart below shows response times as a function of user load for a repository with 1 million artifacts, for a variety of hardware configurations. Here are the main observations:- More than 32G of RAM is needed to cache the index (75G) associated with 1M artifacts, so the response times and scale limits are lowest in 32G configurations (even with an SSD drive).
- An SSD drive improves scalability slightly, but there are enough inconsistencies in when the bottlenecks form to make it hard to draw solid conclusions as far as scalability goes beyond 450 users. But the response times at 450 users are best for the 64G SSD configuration (with the 128G HDD configuration coming in second).
- The runs beyond 450u are not considered repeatable. We are using 450 users as the limit, to be conservative.
 The following table outlines the different hardware and JVM heap configurations and the maximum number of users that are supported in each configuration.
|
RM server hardware and JVM configuration |
Jazz Team Server |
DB2 server |
Number of users supported |
|
HDD 32 GB RAM with 16 GB JVM heap |
32 GB RAM with 16 GB JVM heap |
64 GB RAM |
350 |
|
SSD 32 GB RAM with 16 GB JVM heap |
32 GB RAM with 16 GB JVM heap |
64 GB RAM |
400 |
|
HDD 64 GB RAM with 24 GB JVM heap |
32 GB RAM with 16 GB JVM heap |
64 GB RAM |
450 |
|
SSD 64 GB RAM with 24 GB JVM heap |
32 GB RAM with 16 GB JVM heap |
64 GB RAM |
450 |
|
HDD 128 GB RAM with 24 GB JVM heap |
32 GB RAM with 16 GB JVM heap |
64 GB RAM |
450 |
Response times and CPU utilization - all configurations
The table below summarizes the overall average response time and the CPU utilization of the DNG server at different user levels, for the tested hardware configurations. The cells in red indicate that the system was past its limit.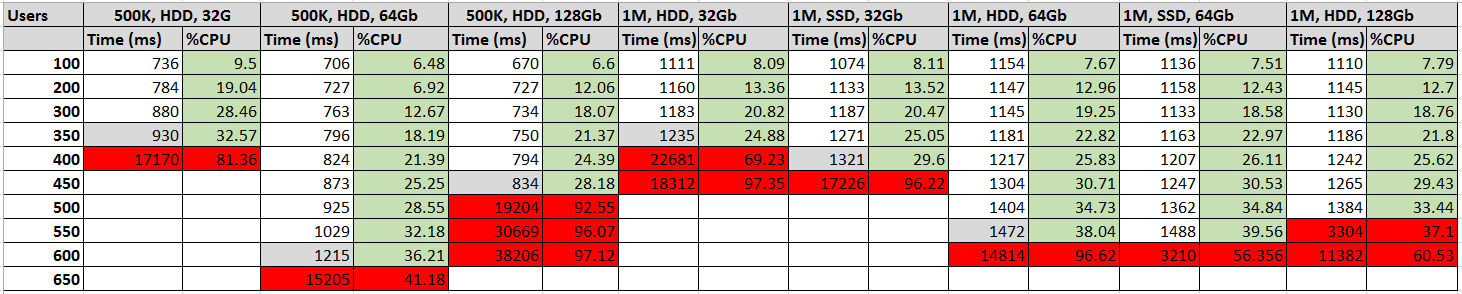
How artifact counts impact configuration management operations
We looked at several of the new configuration management use cases in single-user mode, to see how the response times would be impacted by changing the number of artifacts involved. Here's a summary of what we found:|
Use case |
Sensitivity to counts |
Upper limit of testing |
Typical response time |
| Open configuration UI |
low |
n/a |
2-4 seconds |
| Configuration UI: list baselines |
low |
62 baselines |
4 seconds |
| Configuration UI: list streams |
low |
33 streams |
2-3 seconds |
| Configuration UI: list change sets |
low |
132 change sets |
2-3 seconds |
| Open "switch configuration" UI |
low |
n/a |
4 seconds |
| Switch configuration: search for baseline |
medium |
328 baselines |
up to 12 seconds |
| Switch configuration: search for stream |
medium |
109 streams |
up to 9 seconds |
| Switch configuration: search for change sets |
medium |
2508 change sets |
up to 11 seconds |
| Compare stream: confirm source/target |
low |
n/a |
2 seconds |
| Compare stream: compare project properties |
high |
1300 change sets |
Increases from 3 to 42 seconds |
| Compare stream: compare artifacts |
high |
1300 change sets |
Increases from 8 to 62 seconds |
| Deliver change set: confirm source/target |
high |
n/a |
Increases from 5 to 20 seconds |
| Deliver change set: compare artifacts |
high |
825 changes in change set |
Increases from 8 to 33 seconds |
| Deliver change set: Finish |
high |
825 changes in change set |
Increases from 7 to 19 seconds |
| Deliver to stream: select menu |
high |
1017 changes delivered |
Increases from 15 to 35 seconds |
| Deliver to stream: compare artifacts |
high |
1017 changes delivered | Increases from 5 to 45 seconds |
| Deliver to stream: Finish |
high |
1017 changes delivered | Increases from 15 to 25 seconds |
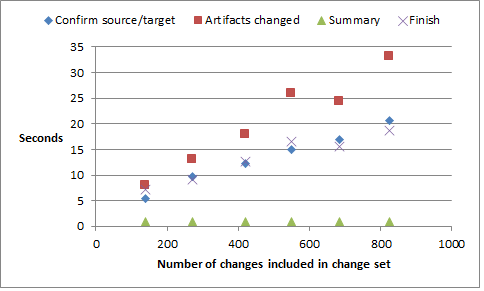
Change set delivery as a function of change set size
This use case looked at how delivering a change set was impacted by the number of changes in the change set. The test sequence involved creating a change set, and then making a controlled number of changes to a module. Then, we delivered the change set and measured the response times of the main operations:- Time to display the "Confirm source/target" UI (after selected the "Deliver change set" menu option)
- Time to display the "Artifacts changed" UI
- Time to "Finish" the deliver
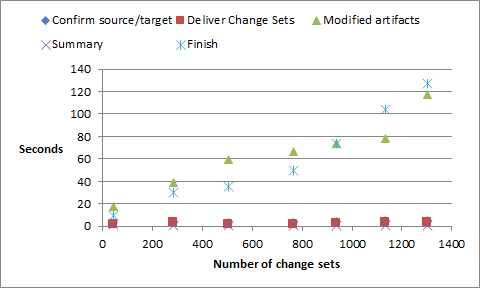
Deliver changes to a stream as a function of change count
This use case looked at how delivering changes from one stream to another was impacted by the number of differences between the two streams. We looked at the following operations in the "Deliver":- Time to display the "Confirm source/target" UI (this appears after selecting the "Compare stream" menu option)
- Time to display the "Modified artifacts UI" UI
- Time to display "Finish" the deliver UI
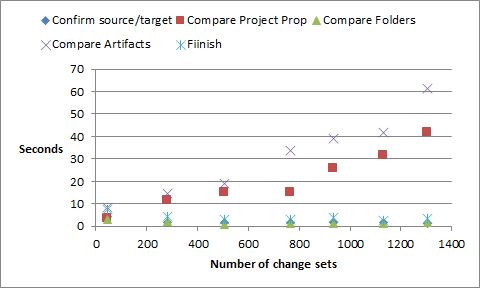
Compare streams as a function of the number of change sets
This use case looked at how comparing two streams was impacted by the number of differences (change sets) between the two streams. In particular, this compared a stream to its parent. Change sets were delivered to the parent stream, while keeping the child stream unchanged. We looked at the following operations in the "Compare streams" operation:- Time to display the "Confirm source/target" UI (this appears after selecting the "Compare stream" menu option)
- Time to display the "Compare project properties" UI
- Time to display the "Compare folders" UI
- Time to display the "Compare artifacts" UI
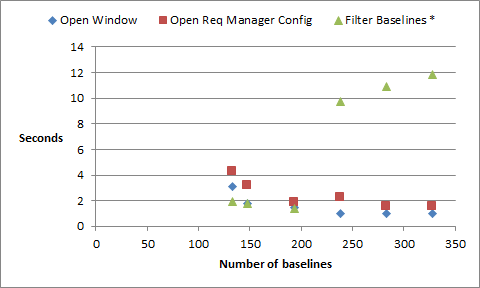
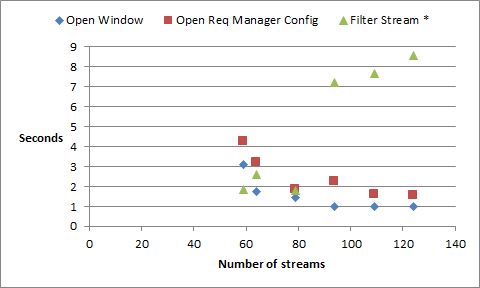
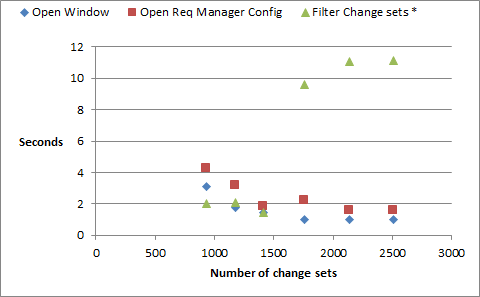
Searching for baselines, streams, and change sets
This use case looked at the cost of searching for baselines, streams, and change sets as a function of count. We did this in the "Switch configuration" UI, and then searching for a configuration. We looked at each step in the process:- Time to open the initial dialog after selecting the "Switch" menu
- Time to select the Requirements Manager Configuration type and waiting for the dialog to refresh
- Time to enter a search string and display a filtered set of results
Appendix A: Topology
The topology that was used in our testing is based on the standard (E1) Enterprise - Distributed / Linux / DB2 topology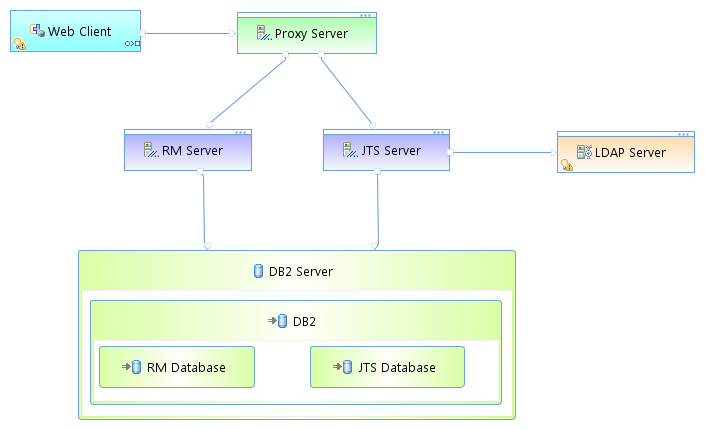 Key:
Key: - RM Server: Rational DOORS Next Generation Server
- JTS: Jazz Team Server
Appendix B: Tested hardware and software configurations
All of the hardware that was tested was 64 bit and supported hyperthreading. The following table shows the server hardware configurations that were used for all of the tests of all repository sizes.|
Function |
Number of machines |
Machine type |
Processor/machine |
Total processor cores/machines |
Memory/machine |
Network interface |
OS and version |
|
|
Proxy Server (IBM HTTP Server and WebSphere Plugin) |
1 |
IBM System x3250 M4 |
1 x Intel Xeon E3-1240v2 3.4 GHz (quad-core) |
8 |
16 GB |
Gigabit Ethernet |
Red Hat Enterprise Linux Server release 6.3 (Santiago) |
|
|
Jazz Team Server WebSphere Application Server 8.5.5.1 |
1 |
IBM System x3550 M4 |
2 x Intel Xeon E5-2640 2.5 GHz (six-core) |
24 |
32 GB |
Gigabit Ethernet |
Red Hat Enterprise Linux Server release 6.3 (Santiago) |
|
|
RM server WebSphere Application Server 8.5.5.1 |
1 |
IBM System x3550 M4 |
2 x Intel Xeon E5-2640 2.5 GHz (six-core) |
24 |
Varied, depending on the repository size and hard disk type. 32 GB to 128 GB |
Gigabit Ethernet |
Red Hat Enterprise Linux Server release 6.3 (Santiago) |
|
|
Database server DB2 10.1.2 |
1 |
IBM System x3650 M4 |
2 x Intel Xeon E5-2640 2.5 GHz (six-core) |
24 |
64 GB |
Gigabit Ethernet |
Red Hat Enterprise Linux Server release 6.3 (Santiago) |
|
|
Network switches |
N/A |
Cisco 2960G-24TC-L |
N/A |
N/A |
|
Gigabit Ethernet |
24 Ethernet 10/100/1000 ports |
|
Appendix C: Test data shape and volume
The test data that was used for these sizing guide tests represents extremely large repositories compared to most environments that are currently deployed. The 6.0 tests used repositories containing 500K and 1 million artifacts. The artifacts, modules, comments, links, and other elements were evenly distributed among the projects. Each project had data as shown in the following table.|
Artifact type |
Number |
|
Large modules (10,000 artifacts) |
2 |
|
Medium modules (1500 artifacts) |
40 |
|
Small modules (500 artifacts) |
10 |
|
Folders |
119 |
|
Module artifacts |
85000 |
|
Non-module artifacts |
1181 |
|
Comments |
260582 |
|
Links |
304029 |
|
Collections |
14 |
|
Public tags |
300 |
|
Private tags |
50 |
|
Views |
200 |
|
Terms |
238 |
|
Streams |
15 |
|
Baselines |
15 |
|
Change sets |
600 |
|
Artifact type |
500,000-artifact |
1-million-artifact |
2-million-artifact |
|
Projects |
6 |
12 |
24 |
|
Large modules (10,000 artifacts) |
12 |
24 |
48 |
|
Medium modules (1500 artifacts) |
240 |
480 |
960 |
|
Small modules (500 artifacts) |
60 |
120 |
240 |
|
Folders |
714 |
1428 |
2856 |
|
Module artifacts |
510,000 |
1,020,000 |
2,040,000 |
|
Non-module artifacts |
7086 |
14,172 |
28344 |
|
Comments |
1,563,492 |
3,126,984 |
6,253,968 |
|
Links |
1,824,174 |
3,648,348 |
7,296,696 |
|
Collections |
84 |
168 |
336 |
|
Public tags |
1800 |
3600 |
7200 |
|
Private tags |
300 |
600 |
1200 |
|
Views |
1200 |
2400 |
4800 |
|
Terms |
1428 |
2856 |
5712 |
|
Streams |
90 |
180 |
360 |
|
Baselines |
90 |
180 |
360 |
|
Change sets |
600 |
1200 |
3600 |
|
Index size on disk |
39 GB |
75 GB |
157 GB |
Appendix D: Workload characterization
IBM® Rational® Performance Tester was used to simulate the workload. A Rational Performance Tester script was created for each use case. The scripts are organized by pages; each page represents a user action. Users were distributed into many user groups and each user group repeatedly runs one script (use case). The RM team used the user load stages in Rational Performance Tester to capture the performance for various user loads. We started with 100 simulated users, and increased the load by 100 users every 90 minutes. After the 400 user stage, we increased the user load in increments of 50 up until failure. In each stage, the users set up in 15 minutes. After they log in, they are allowed another 15 minutes to get settled. Then, tests are iterated for 45 minutes. During that time, tests were run with a 1 minute think time between operations for each user. This table shows the use cases and the number of users who were repeatedly running each script. Change sets are created in the default stream.|
Use case |
Description |
Number of users |
|---|---|---|
|
Edit stream |
Select the default configuration. Navigate to the streams, baselines, and change set tabs.. |
2% |
|
Create stream/baseline |
Create a stream and a baseline as children of the default stream. Runs 5 times per hour per user. |
1% |
|
Select random baseline |
Open the Switch configuration UI; select a random baseline and switch to it. |
1% |
|
Select random stream |
Open the Switch configuration UI; select a random stream and switch to it. |
1% |
|
Copy/Paste/Move/Delete |
Create a change set. Open a module that contains 1500 artifacts, select 25 artifacts, move them by using the copy and paste functions, and then delete the copied artifacts. Deliver the change set. |
1% |
|
Create an artifact |
Create a change set. Create non-module artifacts. Deliver the change set. |
3% |
|
Create a collection |
Create a change set. Create collections that contain 10 artifacts. Deliver the change set. |
4% |
|
Create a module artifact end-to-end scenario |
Create a change set. Open a medium module that contains 1500 artifacts, create a module artifact, edit the new artifact, and delete the new artifact. Deliver the change set 75% of the time; discard the change set 25% of the time. |
12% |
|
Create a small module artifact end-to-end scenario |
create a change set. Open a small module that contains 500 artifacts, create a module artifact, edit that new artifact, and delete the new artifact. Deliver the change set 50% of the time; discard the change set 50% of the time. |
6% |
|
Create a comment in a module artifact |
Create a change set. Open a medium module that contains 1500 artifacts, open an artifact that is in the module, expand the Comments section of the artifact, and create a comment. Deliver the change set 83% of the time; discard the change set 17% of the time. |
18% |
|
Hover over a module artifact and edit it |
Create a change set. Open a module that contains 1500 artifacts and hover over an artifact. When the rich hover is displayed, edit the artifact text. Deliver the change set. |
2% |
|
Hover over and open a collection |
Display all of the collections, hover over a collection, and then open it. |
1% |
|
Manage folders |
Click Show Artifacts to display folder tree and then create a folder. Move the new folder into another folder and then delete the folder that you just created. |
1% |
|
Open the project dashboard |
Open a dashboard that displays the default dashboard. |
5% |
|
Search by ID and string |
Open a project, select a folder, search for an artifact by its numeric ID, and click a search result to display an artifact. Search for artifacts by using a generic string search that produces about 50 results. |
9% |
|
Scroll 20 pages in a module |
Open a module that contains 1500 artifacts and then scroll through 20 pages. |
16% |
|
Switch the module view |
Open a module that contains 1500 artifacts and then change the view to add columns that display user-defined attributes. |
14% |
|
Upload a 4 MB file as a new artifact |
Upload a file and create an artifact. |
4% |
Throughput of tests
As explained in the workload characterization, the test load was aggressive and it simulated the load of very active users. After the users were logged in, they continuously ran the scripts, waiting for only 1 minute before running each page. During the tests, transaction throughput statistics were gathered. Those statistics were the basis for the high-level overview of server activity that is shown in the next table.|
Server activity |
100 users in 1 hour |
100 users in 8 hours |
400 users in 8 hours |
|
Number of artifacts created |
369 |
2952 |
11808 |
|
Number of artifacts opened |
280 |
2240 |
8960 |
|
Number of artifacts edited or deleted |
308 |
2464 |
9856 |
|
Display a list of modules |
591 |
4728 |
18912 |
|
Comments created |
162 |
1296 |
5184 |
|
Modules opened |
588 |
4704 |
18816 |
|
Search by ID and open the artifact |
133 |
1064 |
4256 |
|
Search by string |
132 |
1056 |
4224 |
|
Switch module view to filter by attribute |
270 |
2160 |
8640 |
|
Number of module pages scrolled |
834 |
6672 |
26688 |
|
Create stream |
8 |
64 |
256 |
|
Create baseline |
8 |
64 |
256 |
|
Switch to a stream |
104 |
832 |
3328 |
|
Switch to a baseline |
80 |
640 |
2560 |
|
Browse the current configuration |
101 |
808 |
3232 |
|
Create change set |
360 |
2880 |
11520 |
|
Discard change set |
68 |
544 |
2176 |
|
Deliverchange set |
290 |
2320 |
9280 |
Appendix E: Server tuning
JVM heap and GC tuning
In general, the team used 50% of the available RAM as the JVM heap size and did not exceed the maximum heap size of 24 GB. Because the Jazz Team Server had 32 GB of RAM, the team used 16 GB for the maximum heap size. The JVM arguments that the team used to set the JVM heap sizes and the GC policy are as follows:-Xgcpolicy:gencon Xmx16g Xms16g Xmn4G -Xcompressedrefs -Xgc:preferredHeapBase=0x100000000For the DNG server, we used a nursery (-Xmn) of 1/3 the maximum heap size.
Appendix F: Database server hardware
The database server that was used for the testing was IBM DB2 enterprise version 10.1.2. The same hardware and database settings were used for all of the performance tests, irrespective of the repository size. For a database server, the team used an IBM System x3650 M4 with 2 x Intel Xeon E5-2640 2.5 GHz (six-core) and 64G of total RAM . The total number of processor cores/machines was 24. In the tests, one server was used for both the Jazz Team Server and RM databases. The database server that was used for the testing was IBM DB2 enterprise version 10.1.2. The same hardware and database settings were used for all of the performance tests, irrespective of the repository size. In our tests, performance bottlenecks always formed first on the DNG server, due to the interactions around the disk-based indices. The database server was not the limited factor. However, the 6.0 release does use the database server more heavily for storing version information, so we expect that a higher end database server with fast disks) will improve performance as the number of versions and configurations increases.Hard disk capacity and configuration
The database servers should use the RAID 10 configuration with the RAID controller configured with "write back cache." The team observed performance degradation in some use cases when using "write-through" caching. Use a high capacity and high performing hard disk (10K RPM or better).|
Repository |
Combined hard disk usage of the Jazz Team Server and RM databases |
Hard disk size |
|
Up to 500,000 artifacts |
~100 GB |
300 GB |
|
Up to1 million artifacts |
~150 GB |
400 GB |
|
Up to 2 million artifacts |
~300 GB |
700 GB |
Appendix G: Proxy server hardware and configuration (for repositories of all sizes)
The team used the same server hardware to test repositories of all sizes. In general, the proxy server does not slow the performance of the RM server.Processor
The team used IBM System x3250 M4 with 1 x Intel Xeon E3-1240v2 3.4 GHz (quad-core). The total number of processor cores/machines was 8.IHS tuning
For the IHS systems that were used during the tests, in the server pool regulation section (worker.c) of httpd.conf file, these parameters were configured:| ThreadLimit | 25 |
| ServerLimit | 100 |
| StartServers | 2 |
| MaxClients | 2500 |
| SpareThreads | 25 |
| MaxSpareThreads | 500 |
| ThreadsPerChild | 25 |
| MaxRequestsPerChild | 0 |
Appendix H: Server performance benchmarks
Various server performance benchmarks were captured by using Sysbench. The performance benchmarks were captured on the RM server.Using the CPU workload: sysbench --test=cpu --cpu-max-prime=20000 --num-threads=2 run
[root@rtpclmperf54 ~]# sysbench --test=cpu --cpu-max-prime=20000 --num-threads=2 run
sysbench 0.4.12:  multi-threaded system evaluation benchmark

Running the test with following options:
Number of threads: 2

Doing CPU performance benchmark

Threads started!
Done.

Maximum prime number checked in CPU test: 20000


Test execution summary:
    total time:                          14.1474s
    total number of events:              10000
    total time taken by event execution: 28.2911
    per-request statistics:
         min:                                  2.81ms
         avg:                                  2.83ms
         max:                                  4.57ms
         approx.  95 percentile:               2.83ms

Threads fairness:
    events (avg/stddev):           5000.0000/6.00
    execution time (avg/stddev):   14.1456/0.00
Using the threads workload: sysbench --test=threads --thread-locks=1 --max-time=20s run
[root@rtpclmperf54 ~]# sysbench --test=threads --thread-locks=1 --max-time=20s run
sysbench 0.4.12:  multi-threaded system evaluation benchmark

Running the test with following options:
Number of threads: 1

Doing thread subsystem performance test
Thread yields per test: 1000 Locks used: 1
Threads started!
Done.


Test execution summary:
    total time:                          2.4065s
    total number of events:              10000
    total time taken by event execution: 2.4051
    per-request statistics:
         min:                                  0.24ms
         avg:                                  0.24ms
         max:                                  0.66ms
         approx.  95 percentile:               0.25ms

Threads fairness:
    events (avg/stddev):           10000.0000/0.00
    execution time (avg/stddev):   2.4051/0.00
Using the mutex workload: sysbench --test=mutex --num-threads=64 run
[root@rtpclmperf54 ~]# sysbench --test=mutex --num-threads=64 run
sysbench 0.4.12:  multi-threaded system evaluation benchmark

Running the test with following options:
Number of threads: 64

Doing mutex performance test
Threads started!
Done.


Test execution summary:
    total time:                          1.7035s
    total number of events:              64
    total time taken by event execution: 105.7884
    per-request statistics:
         min:                               1526.68ms
         avg:                               1652.94ms
         max:                               1701.69ms
         approx.  95 percentile:            1699.11ms

Threads fairness:
    events (avg/stddev):           1.0000/0.00
    execution time (avg/stddev):   1.6529/0.04
Using the memory workload: sysbench --test=memory --num-threads=4 run
[root@rtpclmperf54 ~]# sysbench --test=memory --num-threads=4 run
sysbench 0.4.12:  multi-threaded system evaluation benchmark

Running the test with following options:
Number of threads: 4

Doing memory operations speed test
Memory block size: 1K

Memory transfer size: 102400M

Memory operations type: write
Memory scope type: global
Threads started!
Done.

Operations performed: 104857600 (1279460.43 ops/sec)

102400.00 MB transferred (1249.47 MB/sec)


Test execution summary:
    total time:                          81.9545s
    total number of events:              104857600
    total time taken by event execution: 161.3530
    per-request statistics:
         min:                                  0.00ms
         avg:                                  0.00ms
         max:                                  2.03ms
         approx.  95 percentile:               0.00ms

Threads fairness:
    events (avg/stddev):           26214400.0000/947576.28
    execution time (avg/stddev):   40.3383/0.67
Appendix I: Hard disk performance benchmarks
HDD performance of RM server measured using the fileio workload
[root@rtpclmperf54 home]# sysbench --test=fileio --file-total-size=150G --file-test-mode=rndrw --max-time=300 --max-requests=0 run
sysbench 0.4.12:  multi-threaded system evaluation benchmark

Running the test with following options:
Number of threads: 1

Extra file open flags: 0
128 files, 1.1719Gb each
150Gb total file size
Block size 16Kb
Number of random requests for random IO: 0
Read/Write ratio for combined random IO test: 1.50
Periodic FSYNC enabled, calling fsync() each 100 requests.
Calling fsync() at the end of test, Enabled.
Using synchronous I/O mode
Doing random r/w test
Threads started!
Time limit exceeded, exiting...
Done.

Operations performed:  83823 Read, 55882 Write, 178816 Other = 318521 Total
Read 1.279Gb  Written 873.16Mb  Total transferred 2.1317Gb  (7.2762Mb/sec)
  465.67 Requests/sec executed

Test execution summary:
    total time:                          300.0057s
    total number of events:              139705
    total time taken by event execution: 292.0346
    per-request statistics:
         min:                                  0.00ms
         avg:                                  2.09ms
         max:                                116.53ms
         approx.  95 percentile:               5.80ms

Threads fairness:
    events (avg/stddev):           139705.0000/0.00
    execution time (avg/stddev):   292.0346/0.00
SSD performance of RM server measured using the fileio workload
[root@rtpclmperf54 data]# sysbench --test=fileio --file-total-size=150G --file-test-mode=rndrw --max-time=300 --max-requests=0 run
sysbench 0.4.12:  multi-threaded system evaluation benchmark

Running the test with following options:
Number of threads: 1

Extra file open flags: 0
128 files, 1.1719Gb each
150Gb total file size
Block size 16Kb
Number of random requests for random IO: 0
Read/Write ratio for combined random IO test: 1.50
Periodic FSYNC enabled, calling fsync() each 100 requests.
Calling fsync() at the end of test, Enabled.
Using synchronous I/O mode
Doing random r/w test
Threads started!
Time limit exceeded, exiting...
Done.

Operations performed:  1039203 Read, 692802 Write, 2216960 Other = 3948965 Total
Read 15.857Gb  Written 10.571Gb  Total transferred 26.428Gb  (90.209Mb/sec)
 5773.35 Requests/sec executed

Test execution summary:
    total time:                          300.0002s
    total number of events:              1732005
    total time taken by event execution: 197.4660
    per-request statistics:
         min:                                  0.00ms
         avg:                                  0.11ms
         max:                                  9.51ms
         approx.  95 percentile:               0.25ms

Threads fairness:
    events (avg/stddev):           1732005.0000/0.00
    execution time (avg/stddev):   197.4660/0.00
Related topics: Deployment web home, Deployment web home
External links:
Additional contributors:


| I | Attachment | Action | Size | Date |
Who | Comment |
|---|---|---|---|---|---|---|
| |
TestTopology.png | manage | 21.5 K | 2015-05-11 - 17:50 | VaughnRokosz | TestTopology |
| |
CompareStream.png | manage | 8.1 K | 2015-05-12 - 16:32 | VaughnRokosz | Response times: compare streams |
| |
DeliverChangeSet.png | manage | 8.3 K | 2015-05-12 - 16:31 | VaughnRokosz | Response times: deliver change set |
| |
DeliverToStream.png | manage | 8.0 K | 2015-05-12 - 17:54 | VaughnRokosz | Response times: deliver between streams |
| |
Switch_FindBaselines.png | manage | 7.0 K | 2015-05-12 - 17:55 | VaughnRokosz | Response times: switch configuration -> search for baseline |
| |
Switch_FindChangeSets.png | manage | 6.9 K | 2015-05-12 - 17:55 | VaughnRokosz | Response times: switch configuration -> search for change sets |
| |
Switch_FindStreams.png | manage | 6.8 K | 2015-05-12 - 17:56 | VaughnRokosz | Response times: switch configuration -> search for streams |
| |
1MResults.png | manage | 51.6 K | 2015-05-28 - 15:14 | UnknownUser | Test results for 1M repository |
| |
500KResults.png | manage | 24.1 K | 2015-05-28 - 15:15 | UnknownUser | Test results for 500K repository |
| |
SummaryTable.png | manage | 31.7 K | 2015-05-28 - 15:16 | UnknownUser | Summary of test results across all configurations |
-
 Deployment web
-
 Planning and design
- Installing and upgrading
- Migrating and evolving
- Integrating
- Administering
- Monitoring
- Troubleshooting
-
 To do
To do
-
 Under construction
- New
-
 Updated
-
 Constant change
- None - stable page
- Smaller versions of status icons for inline text:
-


Contributions are governed by our Terms of Use. Please read the following disclaimer.
Dashboards and work items are no longer publicly available, so some links may be invalid. We now provide similar information through other means. Learn more here.