| Description | |
|---|---|
| Administration |
New Manage Artifact Attachments properties page If you have the Administrator role, a new Manage Artifact Attachments option is available on the Administration menu. This option is visible once the asynchronous migration process is complete. The list view on the page shows the attachments in the project area, such as attachments added to artifacts, images added to the rich-text editor, and data files associated with test data. You can delete the attachments if you have that permission assigned. Deleted attachments are not included in the artifact editors, but are still functional for test data and displayed in the rich-text editor. You can restore deleted attachments from the Trash view or permanently delete them if you have that permission assigned. The rich-text editor displays a file-not-found link for the permanently deleted attachment. Test data with an associated data file that is permanently deleted is not functional. Test executions using the test data will fail. If you open the test data in the editor, you are warned to delete the test data or use another data file. |
| Build artifacts |
Build records and build definitions now support reporting and OSLC Reporting In Report Builder, you can now report on build records and build definitions, and also report on build records linked with test results. Both artifacts are available as top-level resources when you use Lifecycle Query Engine (LQE) as the data source. Note: To use this feature, you must reindex the Quality Management data source in Lifecycle Query Engine. For instructions, see the Interactive Installation Guide. OSLC You can now read and create build record and build definition artifacts for OSLC purposes. Note: You cannot update or delete these artifacts in this context. |
| Categories |
The Values pane now displays the number of category values When you view or edit categories, category values are displayed in two locations: in the Categories pane, as a hierarchy under each category, and in the Values pane, as a list. When a category has many values, the scroll bar for the Values pane indicates that the list is long. Now, the title bar of the Values pane shows the exact number of category values that are listed. Image of the Values pane showing the number of category values: 
|
|
Use the REST API to filter by category type Previously, there was no convenient way to use the REST API to retrieve all category values associated with a specific category type. Now, the following filter is available to query the QM server for all category values associated with a category type: https://<server>:<port>/<context>/service/com.ibm.rqm.integration.service.IIntegrationService/resources/<project area>/category?fields=feed/entry/content/category/categoryType[@href= "https://<server>:<port>/<context>/service/com.ibm.rqm.integration.service.IIntegrationService/resources/<project area>/categoryType/<category type ID>"] |
|
| Command-line adapter |
Consolidate log information in a single file The command-line adapter generates two log files: an output log and an error log. To send the errors to the output log so that all information is one place, you can now use the -redirectError true option when you start the command-line adapter. |
|
Passwords are now prompted and encrypted Previously, when you started the command-line adapter for the first time, you had to enter both your user ID and password at the command prompt, which posed security concerns. Now, when you start the command-line adapter for the first time, you enter your user ID, but the adapter prompts you for your password and then encrypts and stores it. |
|
|
Register multiple command-line adapters with different host names on a single machine You can run multiple command-line adapters on the same machine by providing different values for the optional parameter [-adapter <adapter>]. However, this method maps all the adapters that are running on the same machine to a single lab resource. If all adapters are mapped to a single lab resource, and you reserve that lab resource, all the adapters are reserved and no one else can use any of the adapters. Similarly, if you add that lab resource to a test cell, all adapters become part of that test cell. You cannot individually reserve the adapters and associate them with different test cells. Now, the command-line adapter has a new optional parameter: [-hostName <host name>]. If you provide a value for the -hostName parameter, a lab resource is created with that name and the adapter is mapped to that lab resource. If you run multiple adapters from the same machine with different values for the -adapter parameter and different values for the -hostName parameter, each adapter is mapped to a different lab resource. Then, you can reserve lab resources separately and also add them to different test cells. In addition to the -hostName parameter, you can optionally provide the [-fullyQualifiedDomainName <fully qualified domain name>], [ipAddress <ip address>], and [macAddress <mac address>] parameters. If you do not provide them, the -fullyQualifiedDomainName parameter is the same as the host name, and the "-ipAddress", "-macAddress" parameters are the IP address and MAC address of the real machine on which the adapter is running. |
|
| Configuration management |
Exclude execution records when you merge or clone artifacts, or when you create a stream New project-level options enable you to control whether to include execution records in the artifacts that are brought over to a new stream or to a stream that is the target of a merge or clone operation. The options apply to both test case execution records and test suite execution records. If you exclude the execution records, the related execution results are also excluded. |
| Delete artifacts |
Delete items from the lab management catalog From the Project Properties, you can now delete items from the lab management catalog. Catalog subtypes Previously, you could hide subtypes. Now, you can also delete them. You can delete all subtypes from the catalog, but not root types. To delete subtypes, they must be hidden. To manage hidden items, select the Show hidden lab resource attributes and types check box. To delete a subtype, first ensure that it is hidden. Then, select the item and click the delete button. The item is deleted after you save your changes. Catalog type attributes You can also delete attributes from the lab management catalog. You can delete all attributes from the lab management catalog, but they must be hidden. To manage hidden items, select the Show hidden lab resource attributes and types check box. To delete an attribute, go to Manage Attributes by selecting a type and then clicking the pencil icon. Then, select the item and click the delete button. The item is deleted after you save your changes. |
|
Enhanced support for permanent deletions Artifact templates Previously, artifact templates could be deleted and were visible in the Trash view. Now, administrators can permanently delete and restore deleted artifact templates from the Trash view. Permanently deleted artifact templates are visible in the audit history view. The permanent deletion action does not delete the associated template sections. Project execution variables Administrators can now permanently delete and restore deleted project execution variables from the Trash view. However, permanently deleted project execution variables are listed in the Audit view of the Trash view. The artifact execution variables are permanently deleted when they are removed from the artifacts that contain them. As soon as execution variables are deleted, they are no longer visible in any artifacts, including test cases, test suites, execution scripts, keywords, or execution results. Quality objectives, entry criteria, and exit criteria Previously, objectives from the Entry Criteria, Exit Criteria, and Quality Objectives sections could be deleted from the Manage Quality Objectives option in the same section. Now, deleted objectives are visible in the Trash view and can be permanently deleted and restored from there. Permanently deleted objectives are visible in the audit history view. Any deleted quality objectives will not be available or displayed in the Quality Objectives sections in test plans. Note: To restore or permanently delete quality objectives from the Trash view now requires permission. Permission control has been extended to include quality objectives. Review-enabled artifacts When you permanently delete a formal review artifact, all of the approval groups are deleted from the repository and any sensitive data in them is no longer accessible. Sizing records When the test plan is permanently deleted, the test plan's associated sizing records are now eliminated. |
|
|
Permanently delete execution schedules and their results history When you delete execution schedules, the selected schedules and their results are moved to the Trash view. Administrators can now permanently delete execution schedules and execution schedule results from the Trash view. When an execution schedule is permanently deleted, its associated results are also deleted. After execution schedules or their results are permanently deleted, they cannot be restored and are not listed in the Audit view. |
|
| Email notifications |
Receiving notifications about changes to QM artifacts As an owner, a creator, or a subscriber, you can now receive email notifications about the changes that interest you for the following artifacts:
Image of the Subscribers panel in the artifact editor:  In list views, you can now subscribe to multiple test case or test suite execution records and execution schedules. The row actions include a Subscribe menu option that you can use to subscribe yourself or others to the selected items. Image of the Subscribe menu options in a list view: 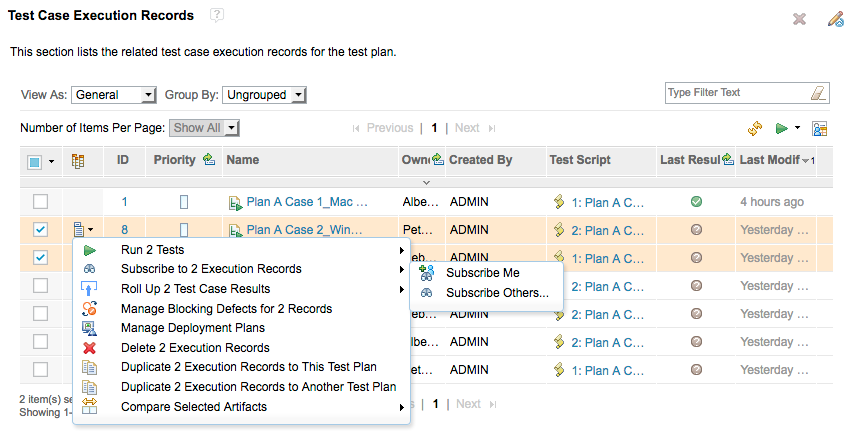 You configure which changes to receive notifications for in the Preferences window, on the Change Notifications page. The Change Notifications page now provides a Subscriber option for receiving notifications. Image of the Preferences window > Change Notifications page:  You can now view all of your artifact subscriptions in a list view. This view displays all artifacts that you are currently subscribed to and provides row actions to unsubscribe from the artifacts. To open this view, click User Profile > View My Artifact Subscriptions. Image of the My Artifact Subscriptions view:  QM notifications support HTML email content. You can set your preferred email format to HTML on your profile page. Image of an email notification in HTML format:  If your project is enabled for configuration management, you can also limit the notifications to specific configurations. Image of the Preferences window for a project with configuration management: 
|
| Excel Importer |
Extended support for importing and linking to requirements with configurations When you use the Excel Importer to import test artifacts into projects that are enabled for configuration management, you can specify which configuration stream to import to. Now, configuration support is also extended to requirements: you can specify a configuration stream when you import requirements and link test artifacts to requirements. When you import requirements or link test artifacts to existing requirements, a dialog box lists all the linked Requirements Management (RM) projects. After successful user authentication, the RM project list is updated with configuration information. If a selected RM project is enabled for configuration management, the Config URI field and Find button are enabled. You can specify the configuration URI manually in the Config URI field or click Find to search for a configuration. After successful user authentication, the available configuration streams for the selected project are listed. Note: The Excel Importer is not aware of global configurations: you must ensure you select QM and RM streams from compatible configurations. For more information, see Rational Quality Manager Word/Excel Importer. |
|
New syntax for linking test cases with existing requirements The configuration syntax for the Rational Quality Manager Excel Importer now supports the following keywords to automatically define links between test cases and existing requirements:
For more information, see Rational Quality Manager Word/Excel Importer. |
|
| Manual test script steps |
Add, update, and delete steps during manual test script execution and merge those changes back to the test script after execution When you execute a manual test, you might need to change manual steps or add and remove them for several reasons:
Instead of having to exit the execution, make changes, and then run the test again to enter the results, you can now add, update, and delete steps during manual test script execution. This feature is disabled by default. To enable this capability, select Manage Project Properties > Execution Preferences > Allow steps to be added and deleted, and the Description and Expected Results columns to be updated during manual test script execution. The ability to add, edit, and delete steps during manual test script execution is also controlled by permissions. The permissions are available under Save test case result. During manual execution, users with this permission can add, edit, and delete steps by using the row-level actions for each step. A shortcut key is also provided for each operation. After the execution is complete, you can merge the changes back into the test script by using the Compare with Test Script Steps button available in the Result Details section. A new Step Modification Status attribute was added to the test case result. By default, the step status of all test case results is Not Modified. If steps are modified, added, or deleted during execution, the step status becomes Modified. When you merge changes back into the test script, the step status becomes Merged. The browse test case result table has a new column named Step Status that you can use to filter test case results. You can also perform the Compare with Test Script Steps action from the browse test case result table. This feature has the following limitations:
|
|
More views of script step information Columns for script steps The following columns are now available in the test case execution record (TCER) view:
Filters for script steps The following filters for script steps are now available: Test Cases view
Also, all test script step count fields are now available in the Reportable REST API, OSLC REST API, and in PDF and CSV exports. For details, see Work Item 15905, Work Item 159503, and Work Item 159502. Execution Status by Number of Steps widget A new Execution Status by Number of Steps dashboard widget is available that shows the execution status by points for test case execution records, test case results, test suite execution records, and test suite results. Image of the Execution Status by Number of Steps dashboard widget: 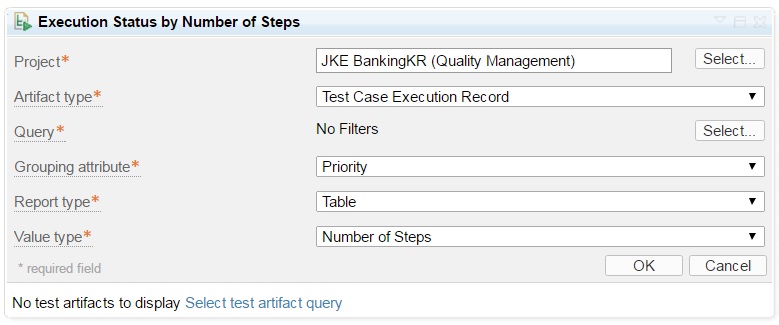 This widget always shows the latest information and does not require a data warehouse. For execution records, the number of steps is calculated based on the last result of the execution record. The widget shows the following types of reports:
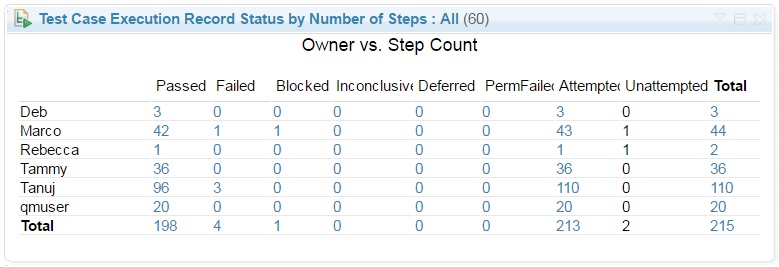 Image of the percentage table:  Image of the stacked bar chart: 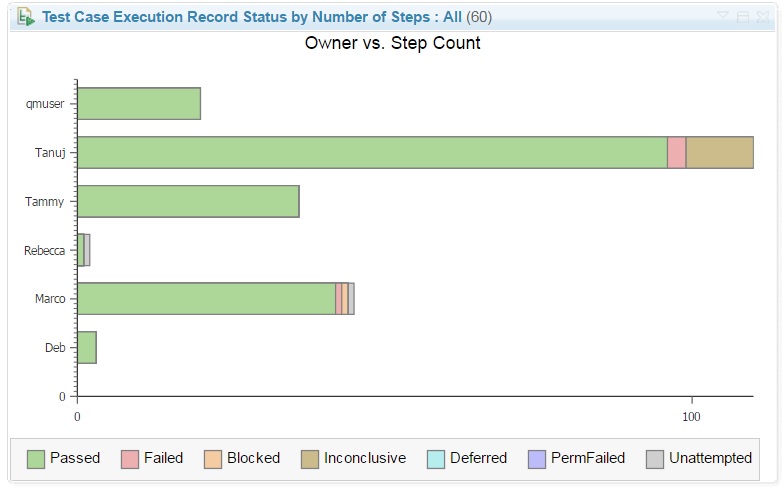 Image of the stacked column chart: 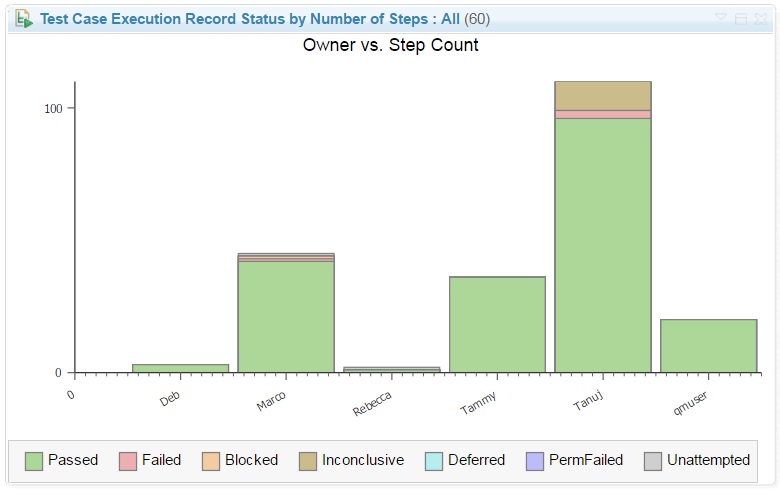 If you click a table cell, stacked bar, or stacked column, the filtered record in the respective table for the test artifact is displayed. |
|
|
Remove individual requirement links from a step of a manual test script In Rational Quality Manager you can link from a single step of a manual test script to multiple requirements. Previously, you could not remove one of those links, you had to remove all the requirement links from a step, not just one. Now, you can remove each requirement link from a manual step individually. Image of removing individual requirement links from a step in a test script: 
|
|
|
View the test script step count for test cases, test scripts, and execution results In the project preferences, in the test script preferences, you can now enable step counting. Make sure that the asynchronous migration process is complete, before you enable step counting. Step counting includes the following features:
|
|
| Migration |
Asynchronous migration Asynchronous migration is a background process that runs after an upgraded Quality Management (QM) server is started. The migration manages migrators, which run a set of modification tasks on specific artifact types that require migration. The migration is performed on chunks of data, and runs periodically until the migration is finished or the migrator is disabled. The migration execution is asynchronous and does not prevent the the server from working or users from performing normal activities while the migration runs. Some new features might not be displayed in the UI until the migration is finished; those features will specify that in their help. Asynchronous migration console Administrators can use the asynchronous migration console to monitor and prevent a migrator from running. The console is available at the following location: https://<domain>:<port>/<qm-context>/migration Image of the console: 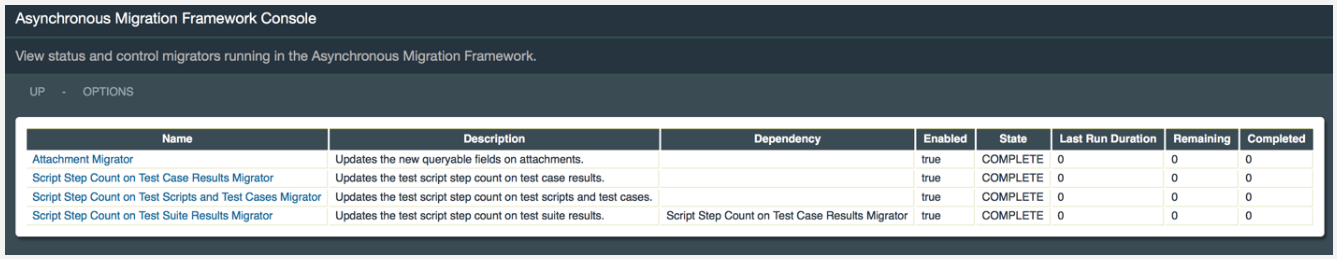 In the table, each row represents a single migrator. Each migrator has information in the following columns: Name and Description: Displays information about the migrator. Dependency: Displays the name of a migrator that must be complete before this migrator can run. Enabled: Indicates whether the migrator is scheduled to run. State: Shows the state of the migrator. Last Run Duration: Provides the time it took for the migrator to run during the last execution. Remaining and Completed: Shows the number of artifacts that are pending and completed. Migration states UNKNOWN: The migrator has not run yet. INITIALIZATION_STARTED: The migrator is being initialized. IN_PROGRESS: The initialization is complete and the migrator has started. WAITING_DEPENDENCY: The initialization is complete, but the migrator will not run until a dependency migrator is finished. COMPLETE: The migrator execution is complete. INCONCLUSIVE: A problem occurred during the initialization or execution of the migrator. Enable and disable migrators To enable or disable a migrator, click the name of the migrator in the console and set the enabled property to true or false. Image of the migrator control for a specific migrator:  Log file A log file named qm-asyncMigration.txt tracks the migration process. The file is located in the logs folder for the QM installation server. |
| Reporting |
Improved category reporting for artifacts Previously in Report Builder, a single property was displayed with all the category values and category types shown in hierarchical mode. Now different properties are displayed, and each property represents a category type with values. These categories are displayed in the final report as separate columns, similar to what is displayed in the Rational Quality Manager web client, and you can use the full capabilities of Report Builder to create filters or sort categories. In addition, only one row is displayed for each artifact when you add category attributes to the report. Note: Multi-valued categories still show multiple entries for the same artifact. To use this feature, you must reindex the Quality Management data source in Lifecycle Query Engine. For instructions, see the Interactive Installation Guide. |
| Table views |
Select or deselect all items on the current page in a table list view Previously, when a table list view supported multiple selections, the table header contained a check box to select or deselect all items in the entire table. That check box did not accurately indicate the selection status of the table. For example, if you selected the check box, it remained selected even if you individually deselected all items in the table. Now, when a table list view supports multiple selection, the table header contains a drop-down menu with the options to select or deselect all items on the current page, and to select or deselect all items on all pages. A selected check box indicates that all items in the table are selected. A deselected check box indicates that no items in the table are selected. A shaded check box indicates that some items in the table are selected, and they might not be displayed on the current page. |
| Test execution |
Cancel execution from the execution tool You can now cancel the execution of test case execution records (TCERs) and test suite execution records (TSERs) from the execution tool. To cancel the execution of a TCER, use this format: ExecutionUtility -requestId=<request ID> -projectName=<project area name> -publicURI=https://<server>:<port>/<context>; -user=<valid user> -password=<correct password> -cancel=true To cancel the execution of a TSER, use this format: ExecutionUtility -tserId=<TSER ID> -projectName=<project area name> -publicURI=https://<server>:<port>/<context>; -user=<valid user> -password=<correct password> -cancel=true |
|
Command adapters from different hosts cannot have the same name A new capability now rejects a connection from a test adapter if the adapter ID already exists but has a different host name for the same project area. If this type of connection is attempted, an error message is displayed that instructs you to register the adapter with a different ID. |
|
|
Execution variables can now pass from result to keyword and from keyword to result During the execution of a manual test script, execution variables are now passed from the previous step to a keyword step. Keywords can use those variables during execution and update their values. Keyword steps can also create new execution variables. As soon as the keyword execution is finished, updated execution variables are available in the next step as well as in the test case result. Updates to the execution variable are available in the next step, whether it is a manual keyword step, an automated keyword step, or a manual step. |
|
|
Manual test steps can now be skipped during manual test execution In the project preferences, in the execution preferences, you can now enable skipped steps. In some cases, one or more steps might not apply when you run a manual test. For example, steps that do not apply to a test execution environment or steps that have previously passed. Instead of assigning an artificial verdict (for example, pass), you can skip these steps without affecting the overall verdict of the execution result. Skipped steps do not affect the overall verdict of the execution result. However, skipped steps are included in the weight distribution of execution results. Similar to deferred steps, skipped steps are not included in the Attempted weight distribution. In addition, skipped steps are included in the step count of execution results. Finally, skipped step information is available in execution records and result editors, list views, rich hovers, and reports. To skip a single step, assign the Skipped verdict to the step. To skip all steps that follow the current step, click Apply All and assign the Skipped verdict. Note, all steps cannot be skipped. |
|
|
New advanced server property to set the maximum number of offline executions Administrators can now use an advanced server property to specify the maximum number of offline executions that can run at one time. Previously, the maximum number of offline executions was set to 50 and was not editable. When offline execution runs, if selected test case execution records do not have a valid test script assigned, you can now skip the invalid items instead of them blocking the execution. |
|
|
New built-in execution variables Built-in execution variables provide information about the test execution environment where tests run. Three new built-in variables were introduced:
|
|
|
New preference to automatically populate an empty actual result when manual step execution passes The actual result of a manual test script step is filled in by the tester. If the tester doesn't enter a result, the actual result is empty by default. It is very common for a test step to pass without any additional information needed in the actual result. For projects that don't allow an empty actual result, it is tedious to fill in the same content for all passed manual steps. A new preference was added in 6.0.5 to automatically populate an empty actual result when manual step execution passes. There are two options if this preference is enabled: apply the expected result to the actual result, or apply a predefined message to the actual result. If you want an empty actual result when you run a manual step, you can enter a space so that the actual result appears empty but is not, and will not be automatically populated by the new preference. |
|
|
New project property to validate the weight distribution for test result verdicts When a test result is modified, the weight distribution is validated to ensure that weight points are set for the verdict. If no weight point is set for the verdict, a confirmation dialog box reminds the user to set a weight point before saving the changes. Administrators can now turn the project property off in the execution preferences if they don't want to validate the weight distribution for test result verdicts. When users modify a test result, they will not get a validation or confirmation dialog box. |
|
|
Password encryption for the Rational Quality Manager Command Line Execution Tool Password encryption file The Rational Quality Manager Command Line Execution Tool has a new parameter: -createPasswordFile. The parameter creates a password file so that a single user can authenticate with the tool and run multiple executions. In the file, the password line is encrypted so that other users can't see it. Hidden password at the command prompt Now, you no longer have to provide a password to access the execution tool: you are prompted for a password during execution. When you are prompted for a password, the characters that you type are shown as bullets, which hides the password from other people who look at the same monitor. For details about the new parameters, see Rational Quality Manager Command Line Execution Tool. |
|
| Usability enhancements |
Copy the link for the current page All Rational Quality Manager pages have a unique URL that is displayed in the address bar of the browser. You can copy the URL from the address bar and send it to another user to open the same page. However, for the list views that support filters, the filters information is not captured in the URL. You can use a saved query to save the filter information, but personal queries are not accessible by other users. Only administrators can create public shared queries. Until now, sending a link to another user involved describing in detail what was manipulated in the current page. Now, you can use the new action to copy the link for the current page that includes all the required information to re-create the current page. The Copy link for this page icon at the top of the page is available for all list views that support filters in the left sidebar filter panels. All artifact editors are also supported and the link includes the section that is currently selected. Image of the new copy link: 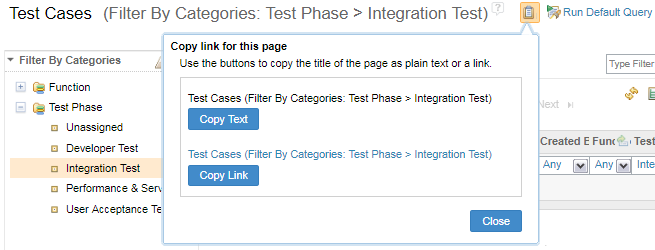 The new action also provides a convenient button to copy the text of the title of the page in one click. For the artifact editors, the title includes the ID and title fields. For the list view, the title is the artifact type and the filter description. |
|
Improved performance for selecting iterations When you select iterations in a dialog box, a tree view displays the iteration hierarchy. Previously, all the iterations were fetched from the server, which could cause performance issues for large projects with many iterations. Now, the dialog box uses a progressive approach that only fetches one level of iterations at a time. Each time you expand a node in the tree view, the next level of iterations is fetched from the server to display the child nodes, which improves the experience for projects with many iterations. |
|
|
New options to filter test artifacts by text type in custom attributes, test environments, and test suites New filtering conditions make it easier to find artifacts and missing artifacts. A common way to filter test artifacts is by using custom attributes. Previously, for Text (Small) and Text (Medium) custom attributes, you could find whether a test artifact contained the filtered word. Now, the following filter options are available for test artifacts:
Image of the new text type custom attribute filter: 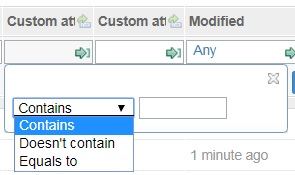 You can also filter test case execution records, test suite execution records, and test case results by the name of test environment. Previously, you could only filter by a sequence of specified characters. Now, you have the same additional options:
Image of the new text type test environment filter: 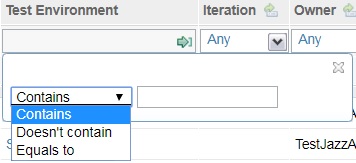 Previously, you could filter test cases by specifying whether they were included in a test suite. Now, you can specify the opposite: that a test case is not included in a test suite. This ability is useful when you add test cases to a test suite, because you can see which test cases do not belong to the current test suite and add them. Image of the new text type test suite filter: 
|
|
|
Support for bottom-up artifact linking When you work on planning artifacts, you associate different types of artifacts. For example, you associate a test plan with multiple test cases, and you associate a test case with one or more test scripts. These associations are supported through the artifact editor of the parent artifact. The test plan editor has a Test Cases section where you can add new or existing test cases to associate with the test plan. Similarly, the test case editor has a Test Scripts section where you can add new or existing test scripts to associate with the test case. Previously, if you were authoring a test script and wanted to associate it with a test case in a test plan, you had to remember the test script, go to the test cases list view, look for the test case, open it in the editor, go to the Test Script section, and look for the test script you were working on. Similarly, you would have to remember the artifacts and search through the list views to associate the test case with the test plan. This top-down design favored the perspective of the parent artifact. In 6.0.5, support was added for a bottom-up design. The right side of the artifact editor contains a pane of parent artifacts, and an action icon is available for associating an artifact with a parent artifact. This design means that you can associate artifacts with a test case in the test script editor and associate artifacts with a test plan or test suite in the test case editor. |
|
| Dashboards and work items are no longer publicly available, so some links may be invalid. We now provide similar information through other means. Learn more here. |