
Improve the value of your Rational solution for Collaborative Lifecycle Management reports using metrics
The Rational solution for Collaborative Lifecycle Management (CLM) is a set of seamlessly integrated applications that work together as one platform for managing the complete lifecycle of your development projects. The application and lifecycle data that your teams create collaboratively for their projects is provided to you for reporting by CLM in a data warehouse. Although CLM provides more than two hundred out of the box and sample reports, with the additional Rational Reporting for Development Intelligence (RRDI) component or alternatively IBM Rational Insight you have access to powerful industry leading report design tools for customizing CLM samples and creating your own reports. With these tools you have access to the data in the warehouse, which is mainly grouped into two categories: operational data (ODS) and metrics. As there is already detailed instructional material available for creating ODS reports [2], [3], [4] this article provides you with a more in-depth look at the metrics available and how to use them. We focus less on the authoring experience, which is covered by a new set of video tutorials [5], but instead will try to answer these frequently asked questions about metrics and CLM:
- Which metrics provided by the product-independent warehouse are recommended for usage with CLM applications?
- What do the metrics' measures and dimensions mean in CLM terms and where does their data come from?
- Which metrics are provided via the CLM Data Collection jobs and which require IBM Rational Insight's Data Manager?
Background
If you had no exposure to the warehouse metrics until now, you might wonder why these questions come up when authoring reports for CLM. The main reason is that the warehouse utilized by CLM follows the exact same schema as IBM Rational Insight. This schema has been designed to provide a product-independent representation of development data so that it can be used with all of Rational's products as well as external products that Rational products integrate with. In addition to the schema, we also provide a common core Reporting Data Model, which is the model that provides end users access to the warehouse data with user-friendly and localized names that you see in the report design tools. This Reporting Data Model defines its own product-independent terminology, which does not necessary match with your applications' terminology, because different applications also use different terms for similar things. Moreover, not all warehouse tables are populated by all applications in the exact same way as each application stores different data even if they operate in the same domain.
For example, you find different information such as attributes about requirements in the warehouse when you use IBM Rational Requirements Composer, IBM Rational Doors, or IBM Rational Requisite Pro. Another example is that work items from CLM's CCM application, IBM Rational Team Concert (RTC), are represented in the same warehouse table called Requests as change requests managed in IBM Rational ClearQuest. Both applications are highly customizable and therefore some data columns can be used differently by each application. However, there is also often a very large intersection of data that is common. This intersection can then be utilized for creating common reports against this one warehouse that can show data from all apps together. For example, the IBM Rational Quality Manager (RQM), CLM's QM application, integrates with all the requirements management applications listed above and all sample reports provided with RQM can show requirements data linked to test artifacts from any of these applications. We can even show a mix of these if more than one of these requirements applications is utilized.
The warehouse can also grow with your integration needs. You might start out with CLM and RRDI, and then later add more Rational or external applications to the mix. As mentioned before, the CLM warehouse uses the exact same core warehouse schema and Reporting Data Model as Rational Insight. (Insight and CLM have some private schemata as well, but these also fit nicely into the scenarios described here.) RRDI currently only supports the three CLM applications, but by switching to Rational Insight you can expand your existing CLM warehouse's usage to become an enterprise-wide warehouse that then also stores data from other applications, such as the ones mentioned in the previous paragraph. In addition to supporting data from applications other than CLM, Rational Insight also provides more sample metrics than CLM does. See [6] for Insight's overview of these metrics. CLM provides data for a sub-set of these metrics, and this article will tell you which additional metrics you get when using Insight.
To summarize this background discussion, the advantage for report authors are that their reports can work with the data from different applications, but the challenge is to map the terminology used by the Reporting Data Model, as well as to know which items of this Reporting Data Model are populated by CLM or any other application. This is true for operational data as well as metrics. For operational data we are providing detailed reference information in [7]. For metrics we provide this article.
The benefits and risks of using metrics
As mentioned above, there are two categories of data in the warehouse: (1) Operational Data (ODS stands for Operational Data Store), which is typically used for query-like list reports that show a representation of the raw application data in the warehouse, such as the list of Test Cases and their attributes, and (2) Metrics. Metrics provide an analytics view on the data. In other words, they represent processed data by taking the ODS data as input and aggregating this data into measures based on some interpretation of it. Measures are typically counts of data items such as the number of Requests, or the number of Test Execution Results. They can also be aggregated sums of numeric data such as the sum of all weight points of failed test case execution records. To qualify these measures they are collected in relation to a number of dimensions. These dimensions allow you to quickly get to the specific numbers that you are looking for.
Figure 1 below shows you how such a metric is represented structurally in the report development tools. You see a breakdown of the Request Metrics into measures, indicated by the ruler icons, such as Actual Work and Total Requests as well as dimensions such as Category or Date, indicated by the axis icons. When you author reports, you basically drag and drop from this tree into a report component such as a chart graph. You use them, for example, for a metric in which you might want to filter the Total number of Requests to the ones that are owned by Project X, are of the type Defect, are in the state Open, and have no owner assigned (owner is referred to by the metrics as Resource in Fig. 1). Hence, project, type, state, and owner would be dimensions of a Request Metric with the measure number of requests. We can then call the application of this metric with this set of dimensions a report that shows us the "Number of open defects that have no owner".
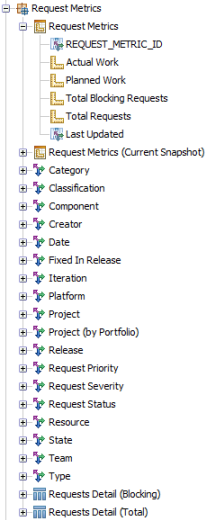
Figure 1: The structure of a metric showing the measures and dimensions.
Metrics are collected in regular intervals, in the CLM case on a daily basis, and therefore provide not only the most recent view of the data, but the trends over time. Using the "Number of open defects that have no owner" example from above, the collected trend information of this measure would allow me now to plot a graph in a report showing the number of defects with no owner over time using the Date dimension. I can therefore provide information about the consistency in which incoming defects are triaged to owners. The interpretation and usefulness of this metric and the reports that show it are now very much dependent on my development process. If my process values the consistent allocation of defects to owners to encourage immediate fixing, then this report is more useful than if my team just picks defects from a ranked backlog whenever they work on defects in allocated timeslots. The users of this report also need to understand that it only shows the trend of open defects, but not the rate of incoming new defects, nor the time it takes to assign them. So one might require multiple metrics to support a development process' goals.
As mentioned above, the usage and usefulness of metrics is highly dependent on your development process and metrics provided out of the box with a CLM solution could either be very process specific or fairly general so that they work in hopefully many cases. The authors of the metrics available in the CLM solution and Rational Insight chose the latter. The dependency of the metrics against the process also holds true for the definition of the metrics themselves. In the example above, the process might change what actually constitutes a defect. For example, a process in Team Concert that provides the input here for counting requests might define completely different types of work items, where the mapping to Defect might be difficult. In the simplest case defects might just called Bugs or in another case the type of the work item is generic, such as Change Request, so that it is not immediately possible to distinguish defects from enhancement requests. Moreover, the notion of the Open state could be different in each process as the workflow of work items in Team Concert or request in ClearQuest can be completely user-defined. Since each project contributing to the warehouse might use a different process, designing a warehouse that provides useful metrics that work with any kind of process is a major challenge. As a user of metrics you need to evaluate each metric in terms of
- What data does it use from each application that provides data in that domain?
- Which development process and application customization were used to create the data and what does that mean for the metric?
- Which process is used to interpret and utilize the metrics?
Getting started with metrics
You write reports that use metrics by selecting a measure and dimensions and applying them to various report components in the report design tool such as graphs or cross-tabs. You would also define prompts that allow you to enter filter values on the dimensions, such as in the examples above: the specific state to be used (which would eliminate the problem of defining what Open means mentioned above), the projects to focus on, and so on. As its generally well-known that a picture tells more than thousand words and a video tells more than ten thousand words, we have prepared a couple of demonstration videos that walk you through the authoring process. Therefore, if you have not seen the videos at [5] yet, in particular the videos titled "Introduction to IBM Rational RRDI v2.0 Report Authoring", "Using the IBM Cognos Query Studio v10.1 User Interface and Data Package", "Build a list report in Cognos Query Studio v10.1", and "Build a Crosstab and Chart in IBM Cognos Query Studio v10.1" then please stop reading now, watch these videos, and return here afterwards.
Welcome back! The video "Build a Crosstab and Chart in IBM Cognos Query Studio v10.1" showed you how you can write a cross-tab and bar chart report using a metric that counted test execution results. It used the Query Studio tool that allowed dragging in query items and immediately executed the current report. To start your own exploration of the metrics available, we recommend using this same tool and begin experimenting. Using the sections below you should start creating similar reports using the metrics that you are interested in with your own data. While exploring the metrics with your own data, you can much better judge how well each metric fits into your development process and what data you have available in your application set-up.
A review of metrics for CLM
The following sections provide a review of key metrics that we think provide relevant data for use with the CLM solution for a range of interesting scenarios. In the RRDI/Rational Insight report design tools metrics are presented by the Reporting Data Model in a tree browser that groups metrics by domain.
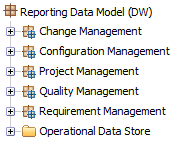
Figure 2: Metrics are grouped by these domains.
This mapping sometimes might not meet your expectations as many metrics use data from more than one domain. The rule of thumb for locating a metric is that the data used for the metric's measures comes from that domain. For example, a metric such as "Request Metrics with Test Plan" would be primarily used for Quality Management reports. However, as it provides measures on requests (i.e. counting defects found during testing of specific test plans) it has been placed in the Change Management group. The following sections are going to review each of these groups except the Project Management one, which is not utilized by CLM. In the Configuration Management group, only the Build metrics provide data related to CLM, but those will also not be discussed here.
A review of common dimensions
Before we review the individual metrics however, let's walk through the list of common dimensions as they are used throughout the groups. The focus of the following Table 1 is on dimensions where the mapping from CLM terminology is not obvious or where additional considerations are required. It is an exhaustive, but not complete list.
Table 1: Common domains used by the metrics.
Dimension Name | Comments |
|---|---|
| Component | Not the SCM components from Team Concert. Not utilized by CLM. |
| Fixed In Release | Does not provide values in CLM as work items are resolved in iterations and the link to the release is missing in the data provided by CLM to the warehouse. |
| Platform | No information is provided by CLM for platform. |
| Product | This dimension does not provide data from CLM. |
| Project (by Portfolio) | Assumes the grouping of project by portfolio, which is not used by CLM. |
A review of Change Management Metrics
Change management metrics provide you with measures around your Team Concert work items. They can be used for scorecards or bar charts giving you counts on open defects as well as trends of the creation or closure of defects or work items of any type. In Figure 3 below you see a sample report that ships with Quality Manager (showing data from our own usage of Team Concert and Quality Manager for development and testing of these products). The report uses the Request Creation and the Request Closure Metrics that you see documented in Table 3 further down. It compares the number of arriving and resolved defects linked to testing following a Test Plan to support an evaluation of quality and team efficiency when it comes to the team being ahead of fixing defects over new defects being uncovered during testing.
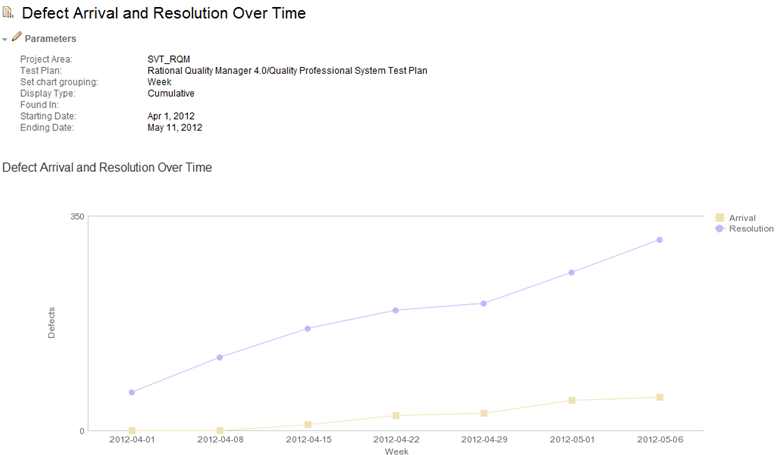
Figure 3: QM’s Defect Arrival and Resolution Over Time sample report.
The following table reviews each of the Change Management Metrics that can be used with CLM. For each metric we list which measures work with CLM data as well as point out any specifics that report authors should be aware of. There were also changes to these metrics between CLM 2011 and 2012 (IBM Rational Insight 1.0.1.1/1.1 and Insight 1.1.1 respectively) that are mentioned here. The table also tells you if a metric is available with CLM’s Data Collection jobs or if it requires the installation of IBM Rational Insight and its Data Manager ETLs.
Table 3: CCM metrics that provide results with CLM data.
Metric Name | Measures using CLM data | Measures not working with CLM | Usage Comments | Requires Insight ETLs |
|---|---|---|---|---|
| Release Request Metrics | Total Request of Pre/Post Release | Total Work | The two measures for pre and post release look at the time difference between the availability date of the release versus the creation of the work item to determine if the request was found before or after the release. However, this metric only has a limited usefulness as it only looks at dates and always considers all work items without boundaries of a project area as work items themselves are not associated with the release. Therefore the sums of post and pre will always be the same: the number of all work items in a project. | yes |
| Release Request Turnaround Metrics | (all) | This metrics follows the approach of the metric above, but it looks at specific statuses (see Status dimension above) and the time work items stayed in these statuses. The measures provide information about the maximum, average and minimum days for a work item to move from submit state to resolve state pre & post a release. The measurements include: total number of requests, maximum, minimum and total days requests spend before and after the release. | yes | |
| Request Aging Metrics [with Test Plan] | (all) | This metrics provides information about the maximum, average and minimum days that requests spend in a particular state. It uses process specific states and not the status in this case. The "with Test Plan" variant of this metric add the test plan dimension to the metric which is key for testers to group work item (defect) measures to test plans. To address the needs of testers, the Iteration dimension here refers to the test plan schedule and the iterations defined in RQM, whereas the other metrics Iteration dimension refers to the Team Concert iterations assigned as Planned For values to the work items. | yes | |
| Request Closure Metrics [with Requirement]|[with Test Plan] | Closure | This metrics provides information about the closure rate of requests. Closed refers in this case to the ‘Closed’ work item group and not specific states with the name Closed. In other words the measurement is total number of requests that are in the Status of Closed (see Table 1 for more details about the Status dimension). The Date dimension is used for this metric to express the actual date when request where moved to a state in the Closed state group. The metrics variants ‘with Requirement’ and ‘with Test Plan’ allow you to access the measure for a specific (set of) requirement or test plan. Note, that the "Request Resolution Metrics" are not listed in this table as they do not work for CLM as there is no work item state group called Resolved. States with the name Resolved are typically added to this Closed state group. | no, for the base metrics yes, for the two variant metrics | |
| Request Creation Metrics [with Requirement]|[with Test Plan] | Arrival | Actual/Planned Duration, Story Points | Similar to the closure metrics this metric uses the Date dimension to count requests created using the Arrival measure. | no, for the base and Test Plan variant yes, for the requirement variant |
| Request Failure Metrics [with Requirement]|[with Test Plan] | Total Requests | This metric will work with your CLM data if you have a work item type that is spelled ‘Defect’, i.e. localized names will not work. For these requests it counts the ones which status was transitioned from a ‘Closed’ status to ‘Open’ (see Table 1 for more information on Status). The interpretation of this measure could be that these defects failed validation or re-testing and had to be reopened. | yes | |
| Request Metrics [with Requirement]|[with Test Plan] | Total Requests, Actual Work, Planned Work | Total Blocking Requests | This is a basic metrics counting requests (i.e. work items) using key dimensions including variants that include linked Test Plans (to report on defects found during testing of a plan) or linked Requirements. Also provides measures for actual and planned work, which can be used for iteration burndown charts that are based on the work item’s Estimate, Correction, and Time Spent fields. Divide the measure by 3600 to get to hours. The Blocking measure does not work with CLM as it does not provide this information in the ODS Request table column on which the metric relies upon. | no |
| Request Turnaround Metrics [with Test Plan] | (all) | This metrics provides information about the maximum, average and minimum days for a request (could be a defect related to a test plan when using the variant metric) to move from the Open Status to Closed. The measurements include: total number of requests, maximum, minimum and total days requests spend. | yes | |
| Story Metrics | Total Story Points, Total Comments, Total Subscribers | Total Tags | This metric provides various measures for work items, which type is spelled ‘Story’, i.e. localized names will not work. You need to use at least Team Concert 3.0.1.2 or newer for the metric to work. For these story work items you are then able to report on the total number of stories, the number of comments submitted against the story and the number of subscribers. The Total Tags measure actually only provides the number of work items that have tags and does not count the number of tags assigned to work items. | yes |
A review of Quality Metrics
Quality metrics mainly refer to test execution results and trends, but also cover areas such as the utilization of lab assets or the status of test case authoring within a project. Figure 4 shows a very popular sample report shipping with Quality Manager that uses (1) the Execution Result Points Metrics with Iteration metric, (2) the Execution Work Item Metrics with Iteration metric, as well as (3) ODS tables that contain plan data to show a team’s execution performance. It plots points for executed tests (points: a metric that allows expressing the effort of running tests) comparing attempted versus completed points for each week. It presents three pairs of these trends: the Planned, which was an allocation of estimated points over time in the test plan schedule (3), the Computed which is a summation of the points estimated for each test case execution record assigned to the plan and milestone provided by the second metric, as well as the actuals of what the team has executed until a certain date provided by the first metric.
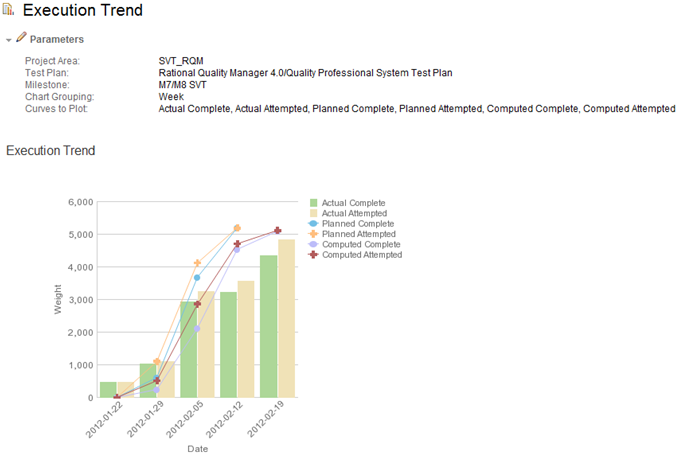
Figure 4: Execution Trend report showing a team’s estimated against their actual test performance.
The following table lists all metrics that can be used with CLM data following the same schema as the CCM metrics discussion above.
Table 4: QM metrics that provide results with CLM data.
Metric Name | Measures using CLM data | Measures not working with CLM | Usage Comments | Requires Insight ETLs |
|---|---|---|---|---|
| Execution Result Date Metrics | (all) | This metric provides a summary of execution results using the result’s actual start date for the Date dimension. Other execution result metrics populate the Date dimension with the data collection date and count all the results available at that date. This metric however counts results in relation to the actual start date of the execution and therefore only counts results started at that date. The measures provided reflect the individual execution result’s verdicts such as Attempted, Failed, Deferred as allocated by the tester using the sliders in the execution result Web UI. | no | |
| Execution Result Metrics [with Iteration] | Total Execution Results | A simple metric that allows you to count the absolute number of execution results available at the time of collection. The Verdict dimension can be used to focus on specific results such as all the Attempted, Failed, etc. The "with Iteration" variant of the metric requires usage of the Iteration dimension, which refers to a test phase in the schedule of a test plan. | no | |
| Execution Result Point Metrics [with Iteration] | (all) | This is one of the metrics that is used for the Execution Trend report of Figure 4 above. It is used to provide the Actual values of the graph. It provides measures for performed execution points by verdict available at the point in time of the data collection. The iteration variant requires the usage of the iteration dimension in the same was as discussed in the row above. | no | |
| Execution Work Item Metrics [with Iteration]|[with Requirement] | Total Execution Work Items Total Weight | This is the other metric used by the sample report of Figure 4. It is used to provide the Computed values. It provides measures that count the total number of test case execution work items available as well as their total weight. Therefore, when using the Iteration variant of the metric it can be used to access the number of execution work items and their specific sum of points allocated to a particular iteration. The other variant "with Requirement" allows you to filter the metric with sets of specific requirements, which allows you write reports that show when requirements are planned for test when. | no | |
| Job | Total Number of Job Results | This metrics provides information about job execution result base on a lab resource. | no | |
| Lab Utilization Metrics | Total Number of Machines Reserved Machines | This metrics provides information about utilization of lab resources based on their reservation date. | no | |
| Test Case Metrics [with Iteration]|[with Requirement] | Total Test Cases | A simple metric that counts the total number of test cases, but with various dimensions it can be used for reports that show the trends on the state of the test cases for specific test plan iterations as well as considering linked requirements. | no |
A review of Requirements Management Metrics
In this final section we will walk you though the requirements metrics that work with CLM data. In general, note that Requirements Composer currently does not provide any data around changes and requirements versions. Therefore no measure that refers to changes works at the moment.
Table 5: RM metrics that provide results with CLM data.
Metric Name | Measures using CLM data | Measures not working with CLM | Usage Comments | Requires Insight ETLs |
|---|---|---|---|---|
| Child Requirements Metrics | Total Children Requirements | This metric counts the number of requirements that have a parent requirement. | yes | |
| Requirement Metrics [with Test Case]|[with Test Plan] | Total Requirements | Total Changes | These three metrics provide counts for the total number of requirements and requirements that are linked to Test Cases or Test Plans via Requirements Collections. The latter would also count requirements directly linked to Test Plans which is not supported by CLM’s RM, but by other requirements management tools such as Requisite Pro. Note, that several dimensions of these metrics might not work with your RM project as all attributes in RM are custom defined. Only if you have attributes such as Priority or Stability that spell exactly as the dimension names will they provide data for these metric dimension. | no |
| Requirement Traceability | This entry in the tree is actually not a metric, but it allows you to access various ways of requirements tracing to other CLM artifacts. As with the metrics and dimensions listed above, not all entries here are supported by CLM data. Traces to Activities, Customer, Tasks are not available as CLM does not cover these concepts. | no |
Conclusions and Next Steps
In this paper we walked you through the relevant metrics available to you using Rational Reporting for Development Intelligence (RRDI) or Rational Insight with CLM. We showed you which parts of the metrics work, which parts do not as the required data is missing in CLM’s reportable REST APIs. We also listed which metrics are available when using CLM Data Collection/RRDI and which metrics require the extended Rational Insight ETLs for data collection. As a next step you should start exploring these metrics. Use Query or Report Studio as show in the videos in [5] and start creating some reports that use the metrics listed above. Experiment with various dimension filter. You should also review the more than 100 Cognos sample reports that ship with CLM. They utilize most of these metrics in various ways. Open these reports in Report Studio and try to understand the queries that are used to build them.
For more information
- [1] What's New in Rational Reporting For Development Intelligence 2.0
- [2] CLM 2011 reporting workshop
- [3] Building a Report in Rational Common Reporting
- [4] CLM Online Help Reporting Tutorials
- [5] IBM Rational Reporting for Development Intelligence (RRDI), YouTube Playlist
- [6] IBM Rational Insight Online Help: Rational Insight sample metadata model
- [7] IBM Rational CLM solution Online Help: Reporting data dictionaries
About the author
Peter Haumer is a software architect for Portfolio Strategy and Management (PSM) solutions in Rational. Before joining the PSM team he was the component lead for Reporting of the IBM Rational Quality Manager solution. Find a more detailed resume here.
Acknowledgments
I want to thanks my colleague Ashish Apoorva for creating an early version of the Quality Management metrics review and Jun BJ Wang for feedback on those. Thanks to Amanda Brijpaul for feedback on the article and for recording the videos of [5].
Copyright © 2012 IBM Rational Software