
IBM Rational Doors Next Generation 4.0.1 Performance Report
Introduction
IBM Rational DOORS Next Generation 4.0.1 is the next generation requirements management solution for complex software and systems engineering environments helping engineers to work more effectively across disciplines, time zones and supply chains. You can read more here: https://jazz.net/products/rational-doors-next-generation/.
Server Topology
The topology used for our performance testing of DOORS Next Generation 4.0.1 was the standard enterprise topology E1. This consists of a distributed Linux CLM Environment served on WebSphere Application Server fronted by an IBM HTTP Server. The database lives on Linux as well and is a DB2 server. LDAP is provided by Tivoli Directory Server. All users are given floating licenses. For more information, the link to the E1 topology can be found in the Related Information section below.
Here are the specific versions of software we used:
| Software | Version |
|---|---|
| IBM HTTP Server | 8.0.0.3 (Apache 2.2.15) |
| IBM DB2 Enterprise Server Edition | 9.7.0.6 |
| IBM WebSphere Application Server ND | 8.0.0.3 |
Hardware Description
This table lists the servers that were used for our testing.
| Role | Manufacturer / Model | CPU | Number of CPU/Cores | CPU Speed | Memory | OS |
|---|---|---|---|---|---|---|
| IBM HTTP Server | IBM x3250 M3 | Intel Xeon X3480 | 1 / 4 | 3.07 GHz | 16 GB | RedHat Enterprise Linux Server 64-bit v6.3 |
| CLM – JTS Server | IBM x3550 M3 | Intel Xeon X5667 | 2 / 8 | 3.07 GHz | 32 GB | RedHat Enterprise Linux Server 64-bit v6.3 |
| CLM – RTC Server | IBM x3550 M3 | Intel Xeon X5667 | 1 / 4 | 3.07 GHz | 32 GB | RedHat Enterprise Linux Server 64-bit v6.2 |
| CLM – RQM Server | IBM x3650 M3 | Intel Xeon X5667 | 1 / 4 | 3.07 GHz | 32 GB | RedHat Enterprise Linux Server 64-bit v6.2 |
| CLM – RRS Server | IBM x3550 M3 | Intel Xeon X5667 | 2 / 8 | 3.07 GHz | 32 GB | RedHat Enterprise Linux Server 64-bit v6.3 |
| CLM – DB2 Server | IBM x3550 M3 | Intel Xeon X5667 | 2 / 8 | 3.07 GHz | 32 GB | RedHat Enterprise Linux Server 64-bit v6.3 |
Workload Characterization
The operations below focus on the new Module feature introduced in 4.0.1. Each virtual user executes use cases at a rate of 30 pages per hour per user.
| Use Case | Description | % Composition |
|---|---|---|
| Login | Connect to the server using server credentials | |
| Browse Project | Opens a random project and hovers on a random module | |
| Open Module | Opens a random module | |
| Save Module | Edit Module name and save | 5 |
| Display Dashboard | Open a project’s dashboard | 5 |
| Switch View | Switch the module view by filtering on attribute type and adding columns | 5 |
| Scroll Page | Open a random module and scroll through list of artifacts | 5 |
| Edit Artifact | Add an image and make the text bold of a random artifact using the in-line editor | 15 |
| Create Artifact Link | Select and artifact and add “Link To” link to another artifact | 5 |
| Switch Module | Select browse modules and select another module | 10 |
| Create Artifact | Using the in-line editor, create a new artifact | 5 |
| Copy/Paste 100 Artifacts | Select 100 artifacts and copy/paste those to a new location | 5 |
| Upload Attachment to Artifact | Create a new artifact with an attachment uploaded to it | 2 |
| Delete Artifact | Delete an artifact | 2 |
| Make a Comment | Select a module and create a comment directed to 5 people | 10 |
| Create Report | Create a Document Style Report from the module level with all artifacts included | 2 |
| Import ReqIf | Using Import, import ReqIf file with 3000 artifacts | 2 |
| Import Word Doc | Using Import feature, import word document with 1000 artifacts | 2 |
| Import CSV File | Using Import feature, import CSV file with 1000 artifacts | 2 |
| Create/Perform Review | Create a review with 20 reviewers, 10 artifacts. Save the review then open it and approve one artifact and disapprove the others. | 2 |
| Display Module History | Open the module history. Click on “Audit History” tab. | 10 |
| Link from RQM Test Case to RM Artifact | Browse to a RQM project. Link a test case to an existing RM module artifact. | 2 |
| Rich Hover Artifact from RQM | Browse to a RQM project. Hover over a linked RM module artifact. | 2 |
| Follow Link to RM from RQM | Browse to a RQM project. Click on the link to open a linked RM module artifact. | 2 |
Data Volume
The repository contained 200,000 artifacts in 10 projects with 22 modules per projects. Details of the breakdown are below:
- Small Project Count: 5
- Medium Project Count: 5
- Total number of modules: 220
- Total number of folders: 5120
- Total number of requirement artifacts: 28294
- Total number of module artifacts: 206000
- Total number of collections: 4
- Total reviews: 620
- Total comments: 40949
- Total public tags: 3000
- Total private tags: 500
- Total term count: 264
- Total link count: 316549
Test Results
The performance numbers below were collected by running operations manually using a browser or rich client, while the server was under a 200 user simulated load.| Operation | Web Client (s) | Rich Client (s) |
|---|---|---|
| Switch module view – Filter | 4.2 | 2.4 |
| Switch module view – Display Columns | 3.4 | 3.4 |
| Start editing an artifact | 1.9 | 1.3 |
| Create RM link (drag and drop) | 1.8 | 1.6 |
| Create artifact – open dialog | 1.9 | 0.9 |
| Upload attachment (4mb) and place in a new artifact | 1.1 | 2.2 |
| Delete artifact – from Module | 1.4 | 1.1 |
| Rich hover over a linked RM artifact | 1.3 | 1.5 |
| Rich hover over a linked RM artifact – from RQM | 1.6 | N/A |
| Display user dashboard of reasonable complexity | 5.2 | 8.1 |
| Open module and display first page | 4.5 | 4.3 |
| Open collection and display first page | 1.3 | 1.4 |
| Create OSLC link – RQM | 2.8 | 3.7 |
| Create OSLC link – RTC | 3 | 3.4 |
| Make a comment | 2 | N/A |
| Module save (after modification) | 1.5 | 1.2 |
| Login (measured to display simple project level dashboard) | 3.7 | 3 |
| Copy and paste 100 artifacts | 25.2 | N/A |
| Cut and paste 100 artifacts | 3.5 | N/A |
| Select and delete 100 artifacts – from Module | 2.1 | 1.2 |
| Report generation based on a typical module view | 76 | N/A |
| Word import – 1 typical module (1000) | 293 | 305.3 |
| CSV Import – 1 typical module (1000) | 355 | 210 |
| ReqIF Import – 3 typical modules (1000 each) | 392 | N/A |
| Display module history | 5.8 | 5.2 |
OS Resource Utilization
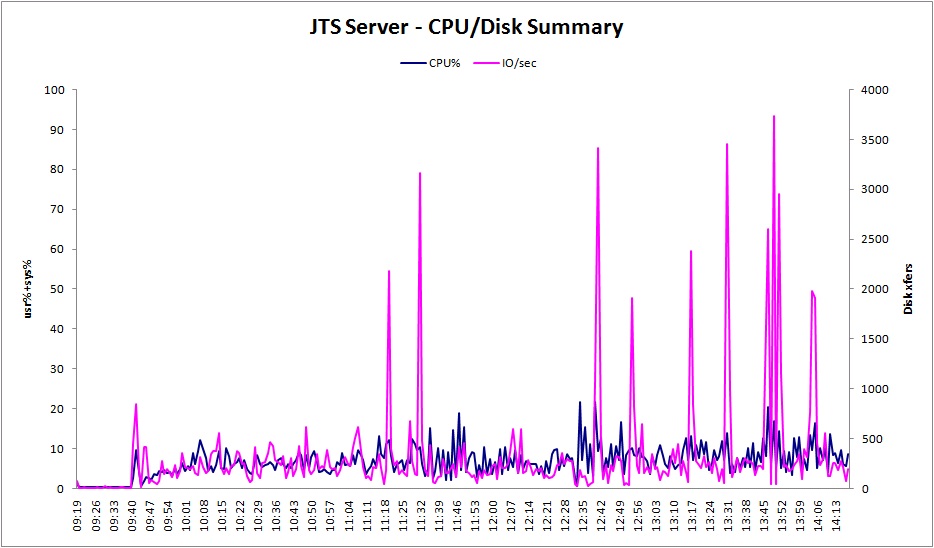
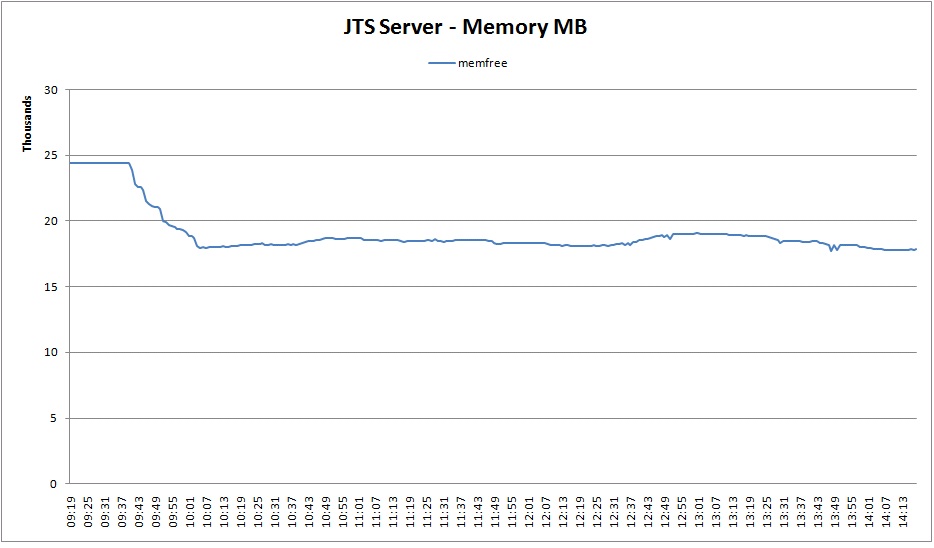
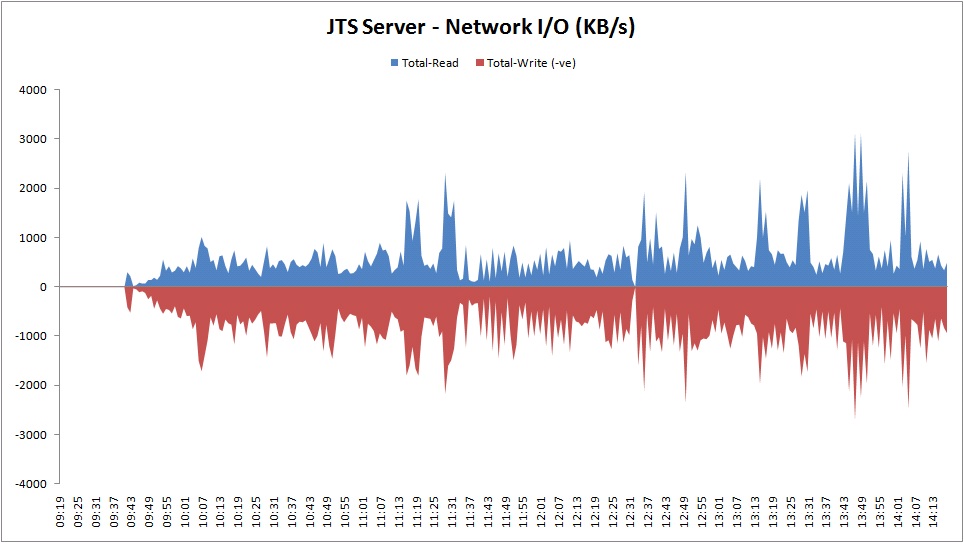
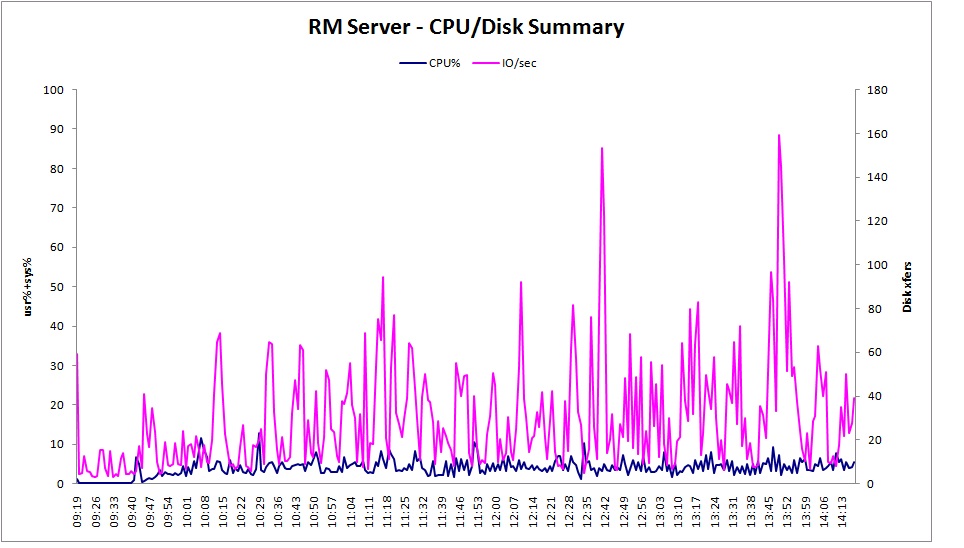
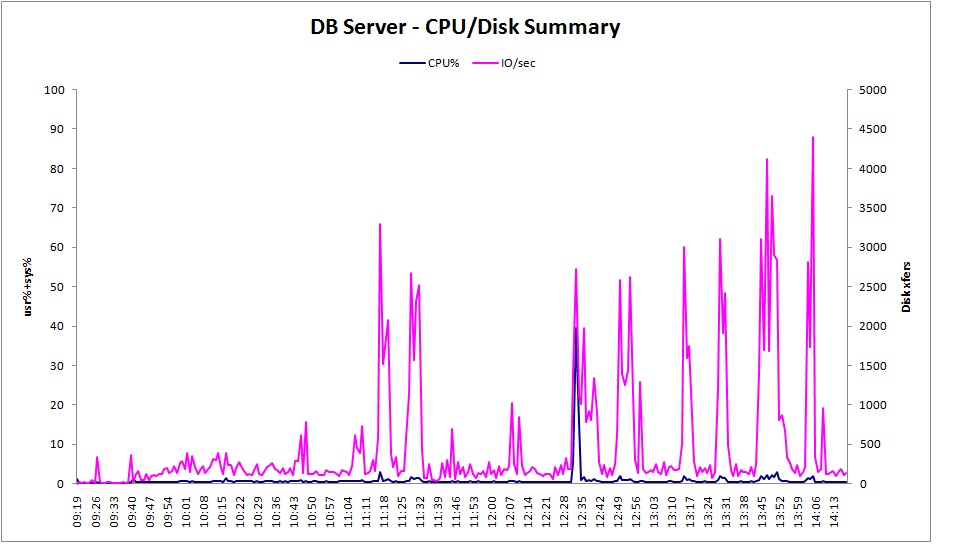
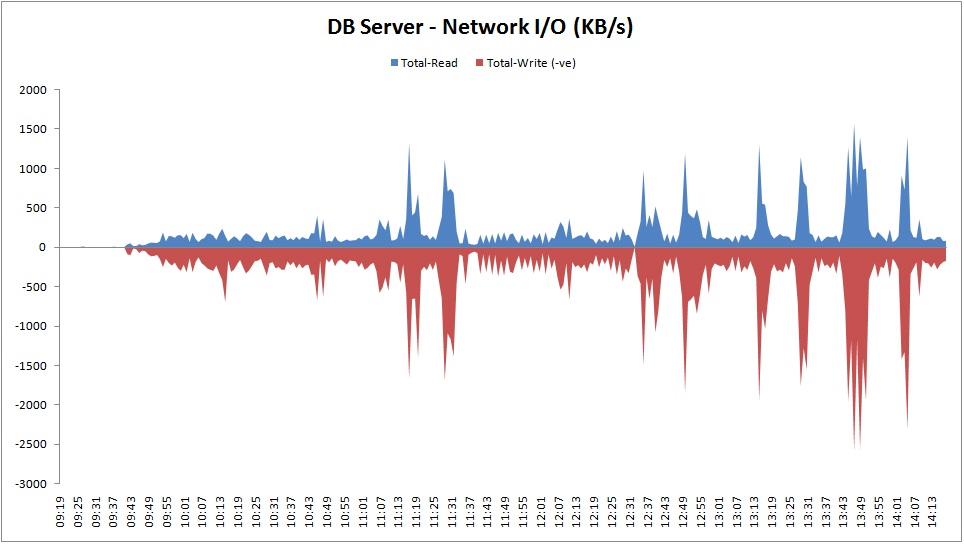
In the charts below, you can see both the resource utilization for CPU, Disk I/O, Memory, and Network I/O. Throughout the runs, we see that resource usage is low in general, with spikes happening during the import operations.
JTS Server:
RM Server:


DB2 Server:

WAS Heap Utilization
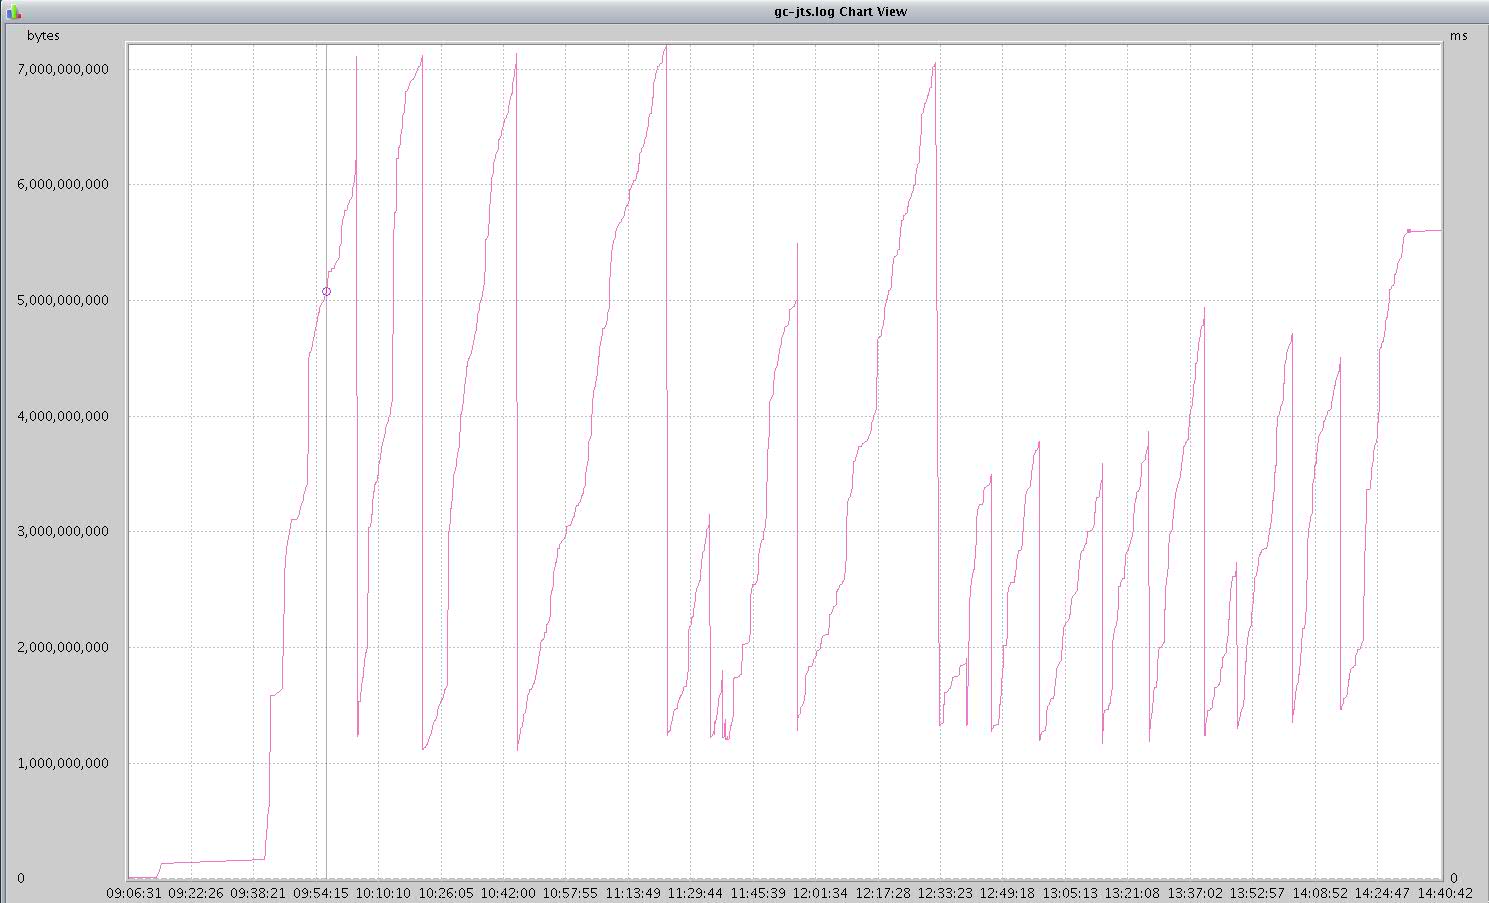
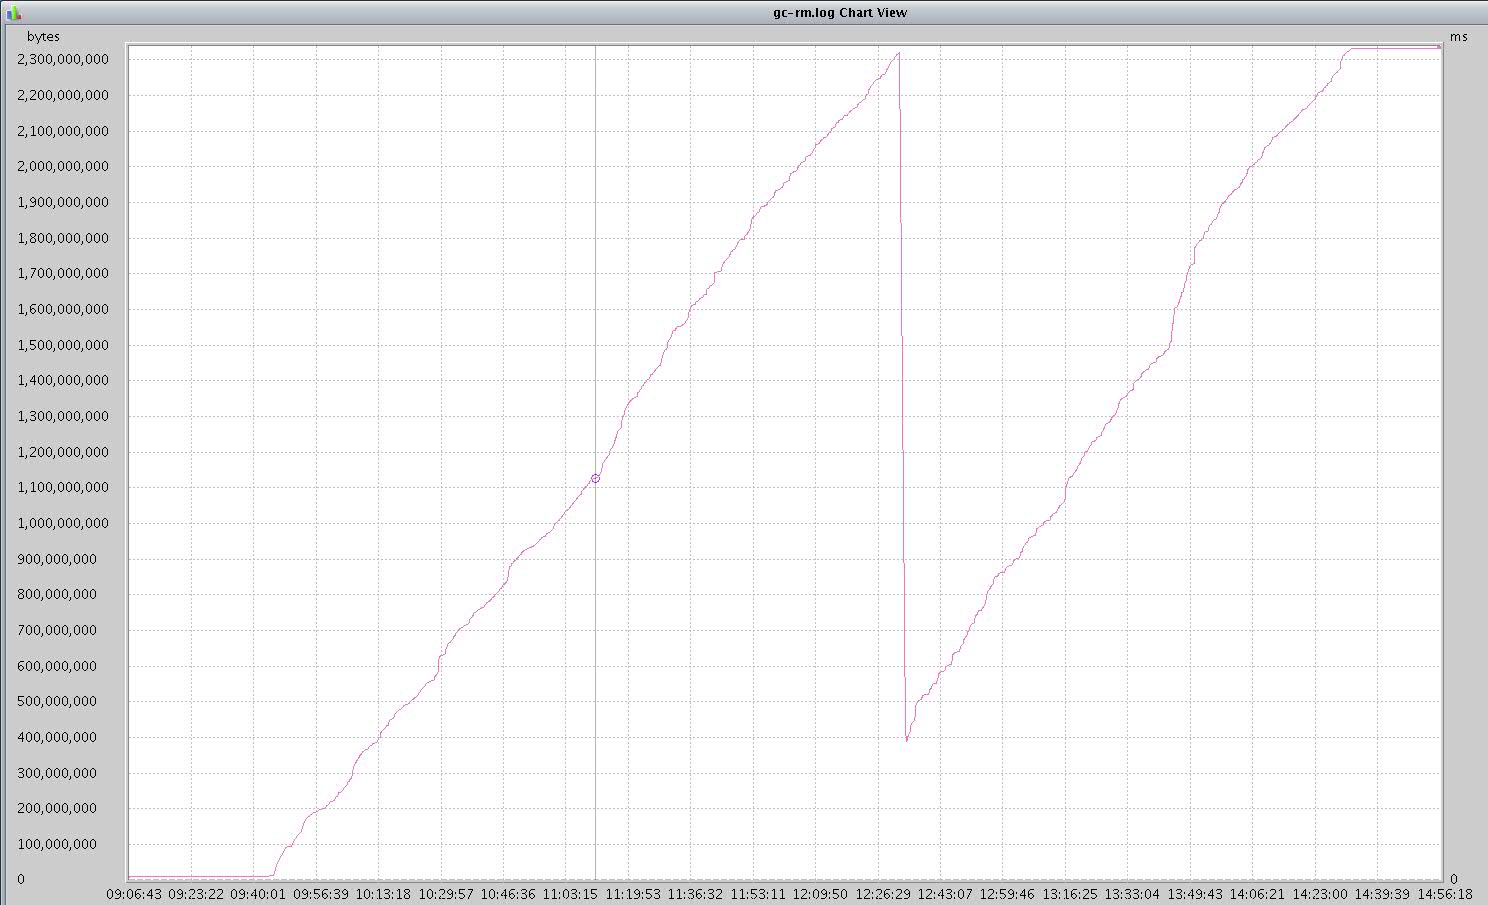
The charts below show the heap usage by both the JTS WAS instance as well as the RM instance. You can see that although we had an 8GB heap for both the JTS and RM Servers, we only got a touch above 7GB for the JTS instance, and only to 2.4 GB for the RM instance.
JTS Server:
RM Server:
Key Tuning Parameters
WebSphere Application Servers
WebContainer set to Min 300 Max 300
JVM max heap set to 8gb
JVM arguments set to:
-Xdump:none -Xdump:heap+java:events=systhrow+user,filter=java/lang/OutOfMemoryError,request=exclusive+prepwalk -Xgcpolicy:gencon -Xmx8g -Xms8g -Xmn1g -Xcompressedrefs -Xgc:preferredHeapBase=0x100000000 -Xverbosegclog:gc.log -Xdump:heap:file=/home/wasdumps/heapdump.%Y%m%d.%H%M%S.%pid.%seq.txt -Xdump:java:file=/home/wasdumps/javacore.%Y%m%d.%H%M%S.%pid.%seq.txt
IBM HTTP Server
In httpd.conf:
<IfModule worker.c> ThreadLimit 25 ServerLimit 48 StartServers 1 MaxClients 1200 MinSpareThreads 25 MaxSpareThreads 75 ThreadsPerChild 25 MaxRequestsPerChild 0 </IfModule>
Related Information
Copyright © 2013 IBM Corporation