
Understanding Collaborative Lifecycle Management performance tuning settings
Summary
There are many tuning settings available for the Rational solution for Collaborative Lifecycle Management (CLM) server including thread pool size, JDBC pool size, JDBC timeout, Mediator size, and more. The parameters don’t work in isolation: a change to one has an effect on the others. This article describes the tuning parameters and the relationships between them, and provides examples.
Architecture
CLM is based on a three-tier architecture. The client (a thick client, a browser, or an external application) makes request to a server. The server then makes one or more requests to the database, organizes the data, and sends it back to the client.
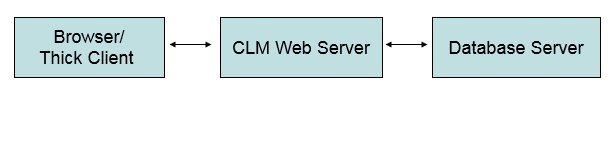
Only the CLM web server interacts with the database. The client doesn’t directly interact with the database.
Database Query
Let’s start with a simple Java application that connects to a database and issues a query.
JDBC (Java-based data access technology) provides a technology for Java to interact with a various databases regardless of vendor. A JDBC application is a Java application that uses this technology. CLM uses JDBC to communicate with the database.
The server and the database communicate via a database connection – a communication path between a database and the server used to send commands and receive data.
The following code shows a JDBC application establishing a connection with a database server, executing a select statement, and collecting the results.
public void run(){ ... Connection connection = DriverManager.getConnection("....", info); PreparedStatement ps = connection.prepareStatement("SELECT SUMMARY FROM MODEL.WORK_ITEM"); ResultSet resultSet = ps.executeQuery(); int i = 1; while(resultSet.next()) { String summary = resultSet.getString(1); System.out.println(summary); } resultSet.close(); ps.close(); } ... If you were to step through this application in a debugger, and stepped over the statement below,
Connection connection = DriverManager.getConnection("....", info); PreparedStatement ps = connection.prepareStatement("SELECT SUMMARY FROM MODEL.WORK_ITEM"); and then issued the netstat command (a command line tool for viewing network statistics), you would see the connection below. The connection is a between two TCP sockets, one on the sample application and one on the database server.
TCP 9.32.240.139:54866 9.32.156.48:50000 ESTABLISHED
After the connection is established, suppose you stepped over the following command. Note that the statement
ResultSet resultSet = ps.executeQuery();
blocks waiting for the database to execute the select statement, so it might take a moment.
Finally, suppose you stepped over the results, you’d see the data that was returned by the query.
while(resultSet.next()) { String summary = resultSet.getString(1); System.out.println(summary); } Simple Server
Let’s say we extended the simple example and used it as the basis for a server. Say, our server accepted one request at a time, processed it via something similar to the
public run(){ ... } function, and then returned.
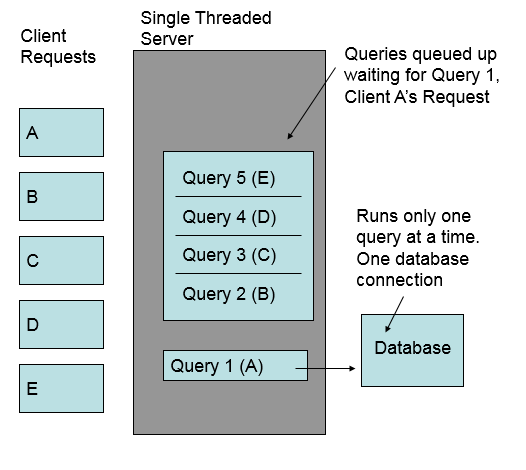
Recall that the
ResultSet resultSet = ps.executeQuery();
statement blocks when it executes. When the query blocked all of the other requests would also block. This wouldn’t be acceptable.
To run more than one command at a time, we’d need to run each query in a separate thread.
Multithreaded Server
Let’s look at how a multithreaded server would look. A multithreaded server would handle each client request in a separate thread. Each thread would run in parallel.
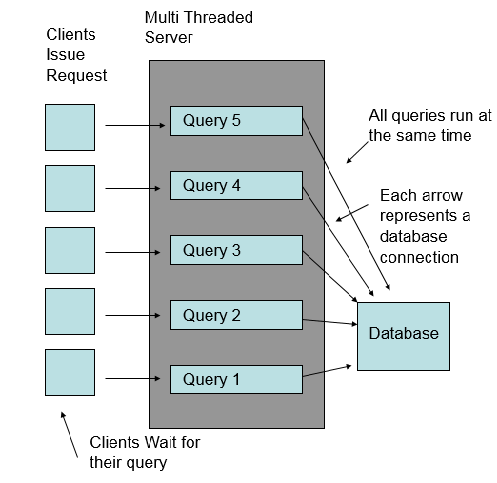
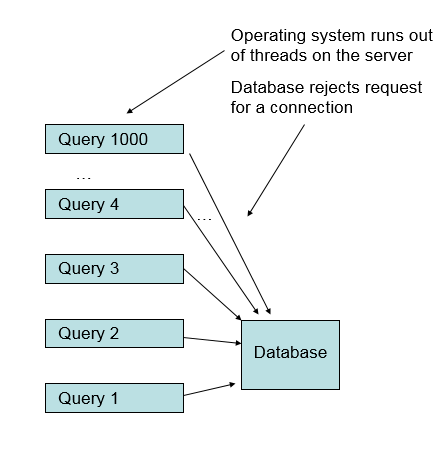
As each incoming request was posted, the server would start a new thread and get a new database connection. Eventually an operating system resources would become depleted. For example, the server could ask for more threads than allowed by the operating system, or the server could try to create more TCP connections than were allowed by the operating system.
Pooling
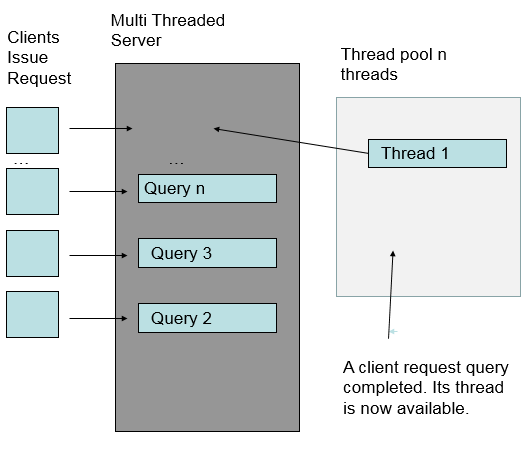
Thread Pooling and JDBC pooling are mechanisms that limit runaway use of server-side resources. Threads and JDBC connections are created as before. The number of threads and connections cannot exceed the thread and JDBC connection pool size. Threads and JDBC connections are reused after being created, saving the time to recreate them.
The application server: WAS or Tomcat manages the thread pool. The thread pool size is a parameter to Tomcat or WAS. The application server refers to the threads that handle client requests as container threads. Container threads are pooled.
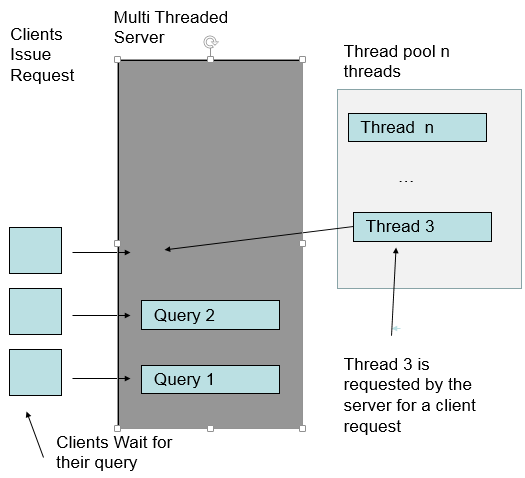
When a request is completed, the thread it was running on is returned to the pool. It can be reused by another request. If too many requests come in, the requests block waiting for a free entry in a pool.
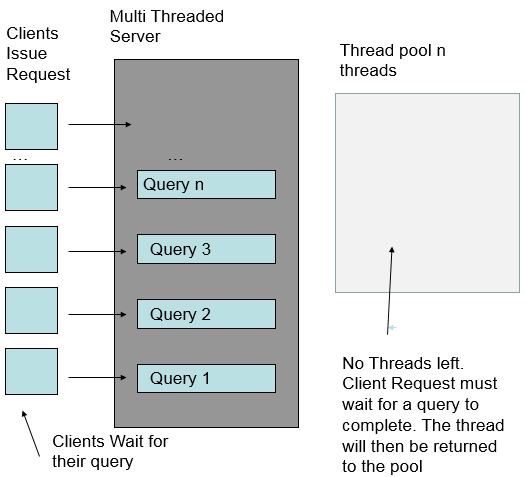
Think of this as like waiting for a lane at your local swimming pool. If all the lanes are taken, you have to wait. The size of the pool determines how many people can be swimming at the same time.
JDBC Connections are also pooled. When the server requests a JDBC connection, one is created; once it’s no longer needed it’s released and can be reused. The CLM system manages the JDBC connection pool.
When a server thread makes a request to the database for a connection, it might get an already pooled connection (one that was created earlier); it might get a newly returned connection; or, it might not be able to get any connection at all. If it can’t get a connection because all of the available connections are already in use, the server thread blocks. It doesn’t block indefinitely. After 3 seconds the server thread stops waiting. It’s up to the server thread to react, generally it gives up, and aborts the operation. Note that 3 seconds (3000 mill sec in the UI), is the default, but this parameter is tunable.

Connection/Thread relationship
Recall that client requests are assigned to threads as they come into the server. The server thread makes a request for a JDBC connection, and then executes a statement against it. The logic for the thread is similar to the code in the first example. It makes a one or more calls to the database, gets the results, returns the data back to the client, then returns the connection.
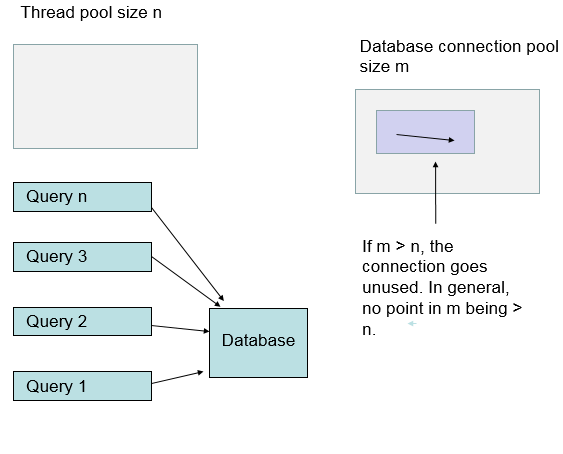
Each thread has at most one JDBC connection. If the thread pool is larger than the connection pool, it’s possible for a thread to block waiting for a connection to become available. If connection pool is larger than the thread pool, only as many connections as are needed will get created. Setting the system up with a large database connection pool, means the system will be bound by the number of threads.
Asynchronous Threads
Not all threads are created as a result of user action. There are background threads started spontaneously by the CLM server. These are referred to as Asynchronous threads. These also interact with the database, and use up database connections. When tuning the system, assume there will be a few more database connections than container threads. The asynchronous threads are also pooled. The default size of the pool is 5 threads. That’s five threads per application. Each application (e.g. CCM, QM, and JTS) has its own Asynchronous thread pool.
Note Asynchronous tasks are sensitive to any failure such as the inability to get a connection. When an asynchronous task is unable to get a database connection, the asynchronous task is canceled. Some of these tasks, such as, cleanup handlers, are needed to for a long-running server to be healthy. The inability to get a connection can compromise this. Running out of database connections can cause more than performance problems.
Indexing
Indexing threads for JFS-based applications (e.g. DM, RM) also use database connections. There are up to four indexing threads per application.
Mediator
The database mediator is an object in Jazz that allows several different objects to work together. In general, there is one mediator object for each connection. The mediator objects are pooled; the Mediator Pool Size setting defines the default size of the pool. The mediator pool size should be the same as the database connection pool size.
In CLM the mediator oversees the database connection, the database provider (each database has a slightly different form of SQL, and slightly different JDBC driver behavior), and various caches. Mediators are used to oversee database transaction that involve updating more than one table.
Transactions
Sometimes a single user action like saving a workitem requires several database tables to be updated.
Update the ITEM_STATE table with a new STATE Update the ITEM_CURRENTS table to reference the new STATE Update the MODEL_WORKITEM table with the new data and reference to the new state. ....
The update operations are executed in the context of a transaction. The changes aren’t committed until the transaction is committed. As long as the transaction is open, new statements can be added. If one of the statements fails and can’t recover, then the application rolls the transaction back. In JDBC, the connection object manages the transaction state. The following statements are executed to commit the transaction, and make it permanent.
connection.commit() or connection.rollback()
When an update statement is executed, the database locks either a part of the table (a row lock), or the whole table (a table lock). These locks prevent other transactions from locking the tables they need. If a transaction has too many open statements, the transaction will affect the performance of the database by blocking other statements.
Server Side Paging
Some operations (e.g. show me all the testcases on the system), return very large result sets, bigger than a client like a web browser could hold. The CLM server typically returns only the data that is currently visible in the client. As the user pages through the data, selecting a ‘Next’ or ‘Back’ button, the old data is discarded from the client, and new data is read from the server.
From the server perspective, each request for a new page, is either resolved via a cache hit, or a request to the database to fetch the needed data via an SQL statement. Each time the user selects ‘Next’, CLM runs a query on a container thread. So the server gets a thread from the thread pool, gets a connection from the connection pool, and reads the next page. The connection is released to the connection pool when the thread completes. The server doesn’t leave open database connections with a partially executed query, and fetch the next bit of data when the user selects ‘Next’. Each time a server side thread completes, any connection that is was using is released.
Multiple Applications
Configuring the server with a database connection pool size larger than the container thread pool size (plus other connection consuming threads) guarantees that no thread will block waiting for another thread to return a database connection.
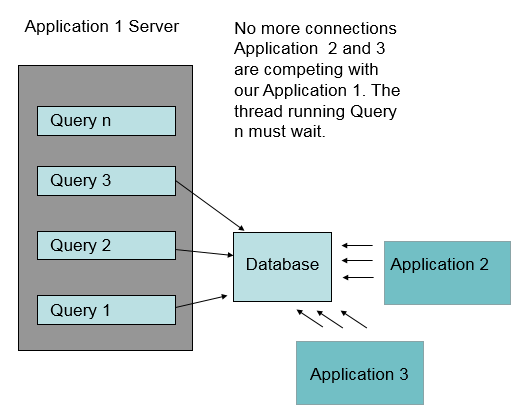
When the same database is used by many applications, the connection pools must be tuned to support the application mix. The database might not have sufficient connections to support a connection pool size that matches the thread pool size of the CLM server. If the database isn’t on a sufficiently powerful machine, it might be too slow to support database requests from all of the container threads.
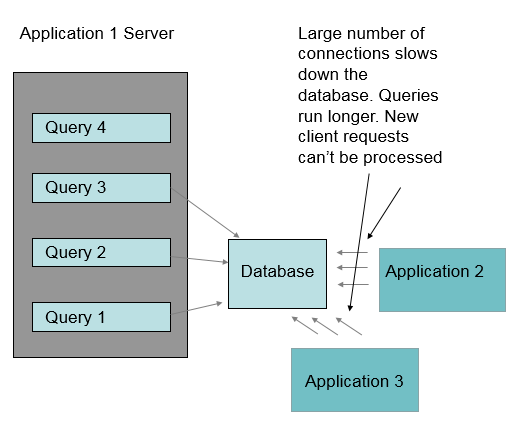
Overburdened Database
When the database is unable to process requests fast enough, more and more threads on the application server end up waiting for database transactions to complete. If the database is too slow, the application server eventually will run out of container threads. Once the application server runs out of server threads, client requests are no longer processed, and the system appears to hang.
If there are more container threads then database connections, then the system won’t hang by running out of threads, incoming transactions will fail because they can’t get database connections.
Memory Management and Garbage Collection
The server caches database data locally. (e.g. workitems, testcases, etc). This cache grows as long as there is free memory. When the server runs short on memory, Java garbage collections is run. The garbage collection pass removes items from the cache. When the items are needed again, the server goes to the database to get this data.
In a running CLM server, much of the memory allocated is used by server-side caches. This can give the illusion that the server is always on the brink of running out of memory, when instead it’s optimized to cache memory and avoid database calls, but give up the memory as soon as it’s needed elsewhere.
Garbage collection runs in a thread, sometimes many threads. These threads run outside the container thread pool. When the system runs low on memory, the threads can use a significant percentage of the server CPU, slowing down other threads, and hurting overall performance.
Database cache
There are two stages in the execution of a complex query: a planning stage, where the database server determines the strategy (e.g.which tables are joined etc.), and an execution phase where it executes the query. Database systems cache the query plan, improving the performance of the query the next time it is executed.
WebSphere Thread Pool Settings
Below are the settings available in WebSphere to tune the thread pool size.
Minimum size – The minimum number of threads permitted in the pool. When an application server starts, no threads are initially assigned to the thread pool. Threads are added to the thread pool as the workload assigned to the application server requires them, until the number of threads in the pool equals the number specified in the minimum size field. After this point in time, additional threads are added and removed as the workload changes. However, the number of threads in the pool never decreases below the number specified in the minimum size field, even if some of the threads are idle.
Maximum size – Specifies the maximum number of threads to maintain in the default thread pool.
Thread inactivity timeout – Specifies the amount of inactivity (in milliseconds) that should elapse before a thread is reclaimed. A value of 0 indicates not to wait, and a negative value (less than 0) means to wait forever.
Tuning tools
Connections
Let’s say, you have a CLM system and you suspect there are too many database connections active at any time. To see the active database connections run the commandnetstat -a or netstat -a | grep <machinename>

Look to see if the number of connections is approaching the size of the connection pool.
WAIT
For more comprehensive analysis of server performance issues use the WAIT tool. This tool is available at https://wait.ibm.com. The WAIT tool analyzes snapshots of the server state, looking for CPU, memory, or other performance issues. On the server machine, WAIT tool scripts gather javacore files and other performance information. Once you have a set of snapshots, submit the snapshot zip file to the WAIT tool.
CPU usage

With the WAIT tool, you can visualize the server CPU usage over time. To understand the details of a CPU spike, (e.g. Full Text Search, SPARQL or some other CPU intensive operation), you’ll need to click on the threads in WAIT, or use a tool to analyze the underlying snapshot (ie the javacore file). Use the tool IBM Thread Monitor to work through details on what’s running in a particular snapshot.
Pay attention to garbage collector threads. Low memory can cause multiple garbage collector threads to garbage collect often, using up CPU time. Also pay attention to indexer threads, both SPARQL and Full Text search index data as it’s created. Importing requirements into RDNG, or importing workitems via a synchronizer create resources that are then indexed. Indexing itself won’t overload the server CPU, but it will backup other operations dependent on it reducing overall throughput. Each indexer runs in a single thread.
Memory usage
Detecting when a server doesn’t have enough memory is tricky.

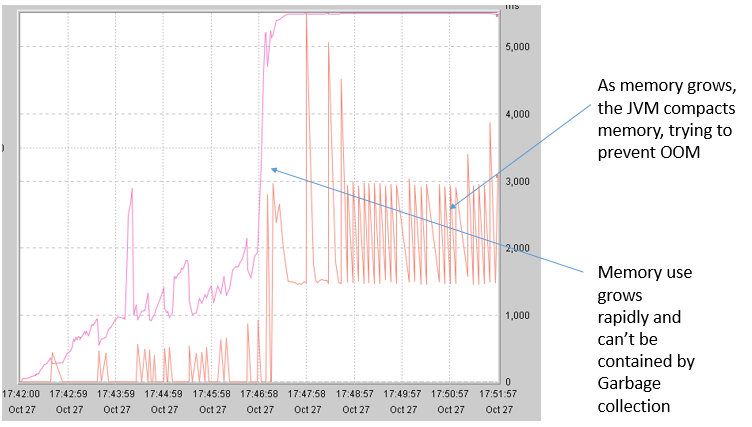
You’d think that when the system memory was near the maximum the system would be on the brink of failure. However, the CLM server retains large caches of useful, but not essential data, (mostly copies of data also in the database) which can be released at a moments notice. The Java garbage collector threads run once the server memory use gets past a certain threshold, releasing cached memory, and making room for new data.

Here’s a more sophisticated way to look for server memory issues. First, look at the javacore files and WAIT data for a server that’s running out of memory. If this is the case restart the server with verboseGC enabled. Think of the JVM as simultaneously allocating and freeing memory: it tries to keep the system in dynamic equilibrium. Container threads allocate memory as needed. Garbage collector threads free memory when it’s no longer used. As space becomes tighter the garbage collector gets more aggressive, and uses more CPU to free up space. IBM Pattern Modeling and Analysis Tool for Java Garbage Collector When the system gets near to running out of memory, Java will desperately garbage collect, trying to keep up with container thread memory allocations. As the garbage collector gets more aggressive, it runs compaction and “stop the world” garbage collections. All threads requesting access to the heap are stopped until the compaction is complete.

One other note about memory use. The Java argument -Xmx specifies the maximum size of the Java heap, but CLM doesn’t always allocate memory to the Java heap. Java NIO interfaces support higher performance I/O operations exploiting the underlying operating system. They allocate memory outside of the Java JVM, directly from the operating system. In CLM, SPARQL index data is read and written using NIO. Note some other Java internal data such as class loader data is also stored in native memory. Make sure you account for native memory when you set JVM -Xmx. It shouldn’t be set to the total memory available on the system. See the tuning guide Tuning Guide for more detail.
Thread Monitor
A thread monitor is a tool that lets you view each threads’s stack at a point in time. It lets you visualize the contents of a javacore quickly and easily. The tool IBM Thread Monitor displays each threads’ stack, and allows you to sort it by thread name, stack depth, or thread state.
Database bound
Using the Thread Monitor
Many common performance problems have a threading signature. Consider the case where the database is over burdened, and needs more resources (memory, CPU, etc). How would you discover this?
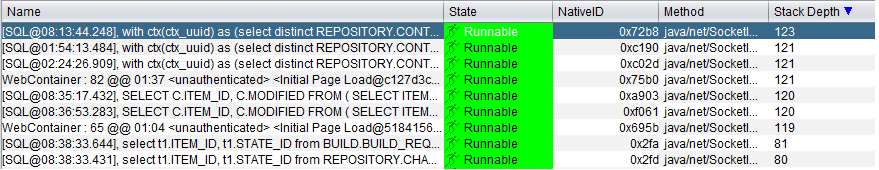
The first step is to sort the data by the thread stack depth. Almost all the important thread data is in classes with deep stack depths. Next determine if threads with high stack depths are waiting for database queries to complete. If there are a lot of threads waiting for the database, then the server is database bound. The server assigns the query text to the thread name when running a query from a container thread. Look at the query text and the stack to determine what user action is running.
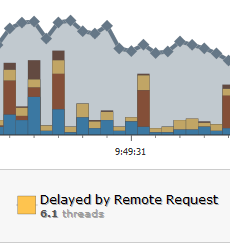
Using WAIT
You can also use the WAIT tool to find database bound servers. In WAIT look for threads that are delayed by a remote request, Click the stacks to see if there are calls to the database. See if the subsequent javacore snapshots are blocked on the same call.
Database bound on a Common Query
Below is a call from CCM to the database to fetch data. The call is waiting for the database to return data.
4XESTACKTRACE at oracle/jdbc/driver/OraclePreparedStatementWrapper.executeQuery(OraclePreparedStatementWrapper.java:1493(Compiled Code)) ... 4XESTACKTRACE at com/ibm/team/repository/service/internal/dataaccess/FetchRows.executeQuery(FetchRows.java:225(Compiled Code)) ... 4XESTACKTRACE at com/ibm/team/repository/service/internal/ExecuteDataQuery.doQueryData(ExecuteDataQuery.java:124(Compiled Code)) 4XESTACKTRACE at com/ibm/team/repository/service/internal/RdbRepositoryDataMediator.queryData(RdbRepositoryDataMediator.java:996(
Look for patterns where the same query is run simultaneously on the server. Sometimes users create complex slow running named queries (e.g. My Complex Slow Query). If several users run the query at the same time, or even worse, the query is part of a dashboard widget, the query can overwhelm the database, and use up a large number of container threads.
CPU bound
Sometimes it’s not a query that slow, but the server itself. In this case, again sort the stacks by depth. In this case look at the running threads. Are a large portion of the threads running actively on the server? In CLM, these threads might be running SPARQL queries. SPARQL queries are most commonly run in the rm and jts applications.
In the case below, the requirements application (rm) is making a request to run a SPARQL query. The search uses up a CPU core until it completes.
4XESTACKTRACE at com/ibm/team/jfs/rdf/internal/jena/tdb/JenaTxTdbProvider.performSelect(JenaTxTdbProvider.java:2013(Compiled Code)) 4XESTACKTRACE at com/ibm/team/jfs/rdf/internal/jena/tdb/JenaTxTdbProvider$23.run(JenaTxTdbProvider.java:2336(Compiled Code)) 4XESTACKTRACE at com/ibm/team/jfs/rdf/internal/jena/tdb/JenaTxTdbProvider$23.run(JenaTxTdbProvider.java:1(Compiled Code)) 4XESTACKTRACE at com/ibm/team/jfs/rdf/internal/jena/tdb/JenaTxTdbProvider.storeOperation(JenaTxTdbProvider.java:2827(Compiled Code)) 4XESTACKTRACE at com/ibm/team/jfs/rdf/internal/jena/tdb/JenaTxTdbProvider.queryHttp(JenaTxTdbProvider.java:2324(Compiled Code)) 4XESTACKTRACE at com/ibm/team/jfs/rdf/internal/jena/JenaQueryService.performQuery(JenaQueryService.java:496(Compiled Code)) 4XESTACKTRACE at com/ibm/team/jfs/rdf/internal/jena/JenaQueryService.perform_POST(JenaQueryService.java:242(Compiled Code))
In other cases, the system is performing a computationally expensive operation like SCM compare workspaces. Sometimes the key to understanding the problem is understanding the context. Does the problem happen only at particular time of day? Many users deliver data near the end of day creating bottlenecks at a particular point in time.
Sometimes there are just too many threads running different tasks on the CLM server. In this case, consider shrinking the thread pool size.
Network bound
Each of the CLM applications (CCM, RDNG, QM…), eventually makes requests of the other applications. A remote application may be on the same server machine, or on a remote machine. When one one application makes a request of another, it uses the HttpClient to initiate communication. If you see HttpClient calls on the stack, then there may be a problem with one of the other servers on the network. This can be caused by a proxy server, network issue, load balancer etc, or may be caused by an overloaded server. In these cases, the initiating server may fail because it runs out of container threads. If a floating license server is on a far off remote machine, HttpClient calls to it can be slow to complete.
Below is a call from QM to JTS to synchronize contributors.
... 4XESTACKTRACE at org/apache/http/protocol/HttpRequestExecutor.execute(HttpRequestExecutor.java:125(Compiled Code)) ... 4XESTACKTRACE at com/ibm/team/repository/service/compatibility/util/http/CrossServerHttpClient.doCommunicate(CrossServerHttpClient.java:185) ... 4XESTACKTRACE at com/ibm/team/repository/service/compatibility/contributor/internal/ContributorSynchronizer.runQuery(ContributorSynchronizer.java:712) 4XESTACKTRACE at com/ibm/team/repository/service/compatibility/contributor/internal/ContributorSynchronizer.runQuery(ContributorSynchronizer.java:699)
Blocked Threads
Single threaded operation
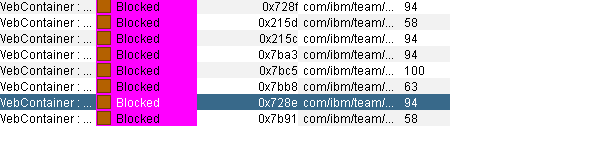
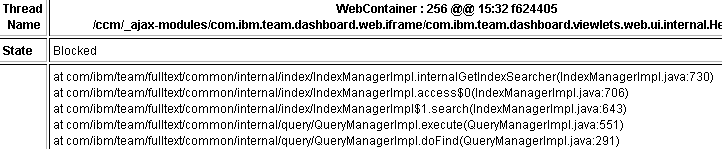
Threads can explicitly block other threads. In CLM, only one full text search query can run at a given time. All of the other full text search queries must wait. This makes it impossible for Full Text Search to slow down the overall system. No matter how many users request a search, only one is run at a time. However, the last user to run the search must wait for all the other users’ requests to finish. If you suspect that you have this type of contention, look at the threads sorted by state. Find threads that are blocked. Look to see if they are all trying to perform a common operation and are blocked at the start of it. Otherwise, look to see if a cache or other resource is under load.
Conclusion
Optimally tuning complex web applications requires the discipline to examine the javacore logs, WAIT logs, and GC logs to isolate the bottlenecks. The tools above provide a framework for finding these problems.
Copyright © 2016 IBM Corporation