
High Availability with Rational solution for Collaborative Lifecycle Management 2012 Clustering
Note: This 2012 article applies to the 4.0 release of the Rational solution for CLM. For current information about clustering and high availability, see Deploying for high availability in the Rational solution for CLM Information Center.
- 1. Introduction
- 1.1 Cold Standby (Prior method of High Availability)
- 1.2 High Availability Goals for 4.0
- 1.3 Challenges
- 1.4 WebSphere eXtreme Scale (WXS)
- 1.5 WebSphere Application Server – Network Deployment Edition (WAS ND)
- 2 Planning for High Availability
- 2.1 Operating System and Platform
- 2.2 Node Sizing
- 2.3 Database Server
- 2.4 Jazz performance indicators
- 2.5 Network
2.6 CPU - 3 Deploying High Availability
- 4 Common Cluster Operations
1. Introduction
The desired level of availability for CLM is very high, with minimal amounts of unplanned down time. This means not having a single point of failure for all the software components and is achieved by having redundant providers of a service or capability. Ideally, the fail-over from one provider to another is transparent to the user or client of a service, but in some cases a failure of a primary provider will require a manual switch.For CLM application this implies having dual or triple redundancy and this is achievable by taking advantage of clustering technologies.
The primary reasons for clustering is to provide true High-Availability (H/A) support with automatic fail-over and balancing load for horizontal scalability. Clustering consists of configuring a group of like servers, and load balancing requests across those servers so that multiple machines appear as one. In such a topology a client request can go to any machine and each machine should ideally respond in the same way. If one of the machines disappears for whatever reason then it will go unnoticed from a client perspective. If a new machine appears, then ideally, a new machine is added then it should offload work from the other machines by assuming some of the work.
1.1 Cold Standby (Prior method of High Availability)
Prior to 4.0 (and still can be used for 4.0) it was possible to provide high availability for CLM applications using a standby topology (hot standby, cold standby).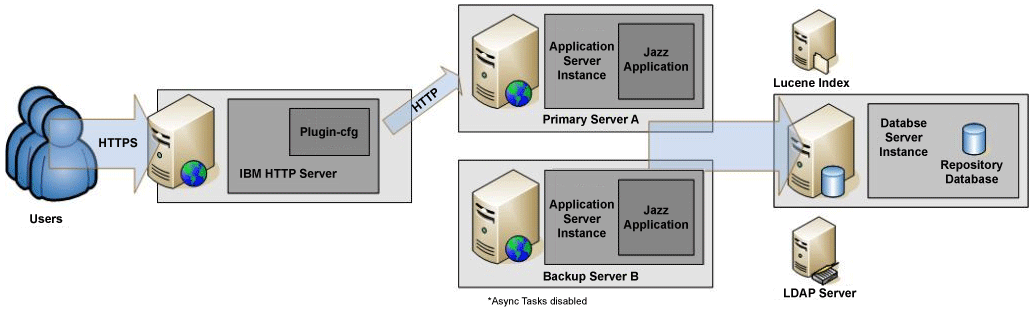
There is also the possibility of automating this using heartbeat technologies available on some OS’s. These technologies can actively monitor servers and execute configuration changes to facilitate a hand over to a standby. One such technology for Linux is pacemaker using IP Failover.
1.2 High Availability Goals for 4.0
Must haves:
- Ability to keep a server operating with no manual intervention in the face of a hardware/software failure on any of the server nodes (ie. as long as one node is alive, the application is responding).
- An individual service request may fail, but subsequent retry would be dispatched to another node automatically. Clients must handle this case gracefully.
- CLM 2012 applications can be deployed in cluster (CCM, QM, RM, JTS, LPA, …).
- Embedded functions such as provided by RRDI, RRDG, Token Licensing and DB persistence must be consumable from clustered apps, and provide high-availability solutions of their own (can be automated fail-over).
- Performance of individual apps should not decline when clustered compared to CLM 3.0.1
- Jazz.net self-hosting on clustered solution
- Documentation of the cluster deployment steps for WAS Network Deployment, including recommendation for primary topology (likely homogeneous nodes)
Nice to Haves:
- Horizontal scaling, the ability to run multiple cluster nodes on the same machine – not primary goal which is HA
- Disaster recovery – ability to locate redundant servers in other site. (Added problem of possibly having bad latency between sites).
1.3 Challenges
In order to improve performance and avoid constant round trips to the database, Jazz applications rely on local caches. In any clustering solution the cache integrity is an absolute prerequisite. Two different instances of an application must be able to rely on equivalent cached data, even when concurrent edits occur, to avoid making inconsistent changes to the database. Therefor, there is a need for some distributed caching technology amongst cluster nodesTo solve this issue there is a need for some in-memory solutions as not using a local cache and relying entirely on DB would simply be too slow. On the other hand, it may also be very expensive to push all local cached data into distributed cache as distributed caches are not free and they can be quite “chatty” as well as saturate the network in additional to the increased memory consumption.
Therefore, it was necessary to rethink the Jazz caching strategy to combine local caching and distributed caching; use distributed cache for reasonable shared data and the distributed cache for invalidating local cache data.
1.4 WebSphere eXtreme Scale (WXS)
To overcome the challenges outlined in 1.3, WebSphere eXtreme Scale (WXS) was used. WXS is IBM’s distributed memory cache solution that provides virtual maps across multiple Java Virtual Machines using replication for fault tolerance and also provides DB write-through support to persistence backend.
CLM leverages the data grid (named ObjectGrid) as a look-aside cache. With your license to run RTC/RQM/RRC you will receive a license to run WXS and there is no need to purchase WXS license separately. All you have to do is install WXS on top of a WebSphere Application Server Network Deployment Edition installation and you will immediately be able to create WXS augmented deployment manager and node agent/application server profiles. This integration provides redundancy for the distributed cache data (both catalog server and map containers)
(A WXS farm could be hosted remotely, and CLM could be configured to use it but this is not currently recommended and not covered by the CLM license entitlement for WXS.)
More information on how Jazz is using WXS is available in the Redbook called “Scalable, Integrated Solutions for Elastic Caching Using IBM WebSphere eXtreme Scale”.
1.5 WebSphere Application Server – Network Deployment Edition (WAS ND)
WebSphere Application Server – Network Deployment Edition (WAS ND) has many services that allow for the creation and easy deployment of clusters. Clusters in WAS ND are groups of application servers that reside on nodes (ex. separate hardware, JVMs) while automatically providing load balancing and routing rules to proxy servers that are also defined within the WAS ND configuration. All of this configuration is done through a central console called deployment manager which communicates to nodes (often residing across network boundaries) using remote agents (called node agents). These node agents provide communication channels that allows the deployment manager to deploy proxy servers, application servers and clusters on remote hardware and concurrently provide rules for proxies about how to route requests through proxies to application servers.An example of a WAS ND cluster topology can be found in the WebSphere Redbook on High Availability and is called a WebSphere system HA level 4 topology. This could be expanded further to include things like site failure mitigation strategies covered in level 5 but as this topic is fully covered in the Redbook and involves software outside the scope of this article (such as LDAP failover, chapter 15.6 ), we will stick to level 4.
The diagram in Figure 1 shows a generic WebSphere system HA level 4 topology. If this generic topology is translated to specific CLM setups then it can look as follows. The first topology show a situation where all applications are deployed into a single application server/cluster member. (Helper applications like Converter, CLM Help, and the Life-cycle Project Administration apps are left out for brevity.)
We will cover the steps about how to setup up such a topology later in this article.
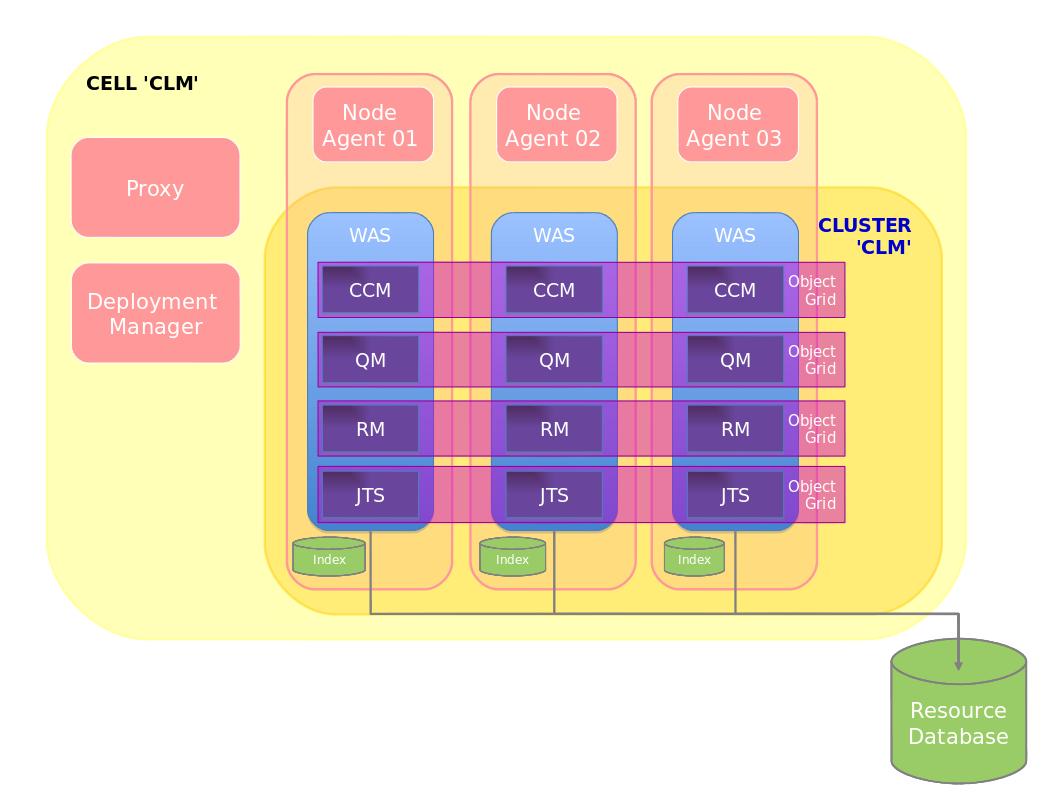
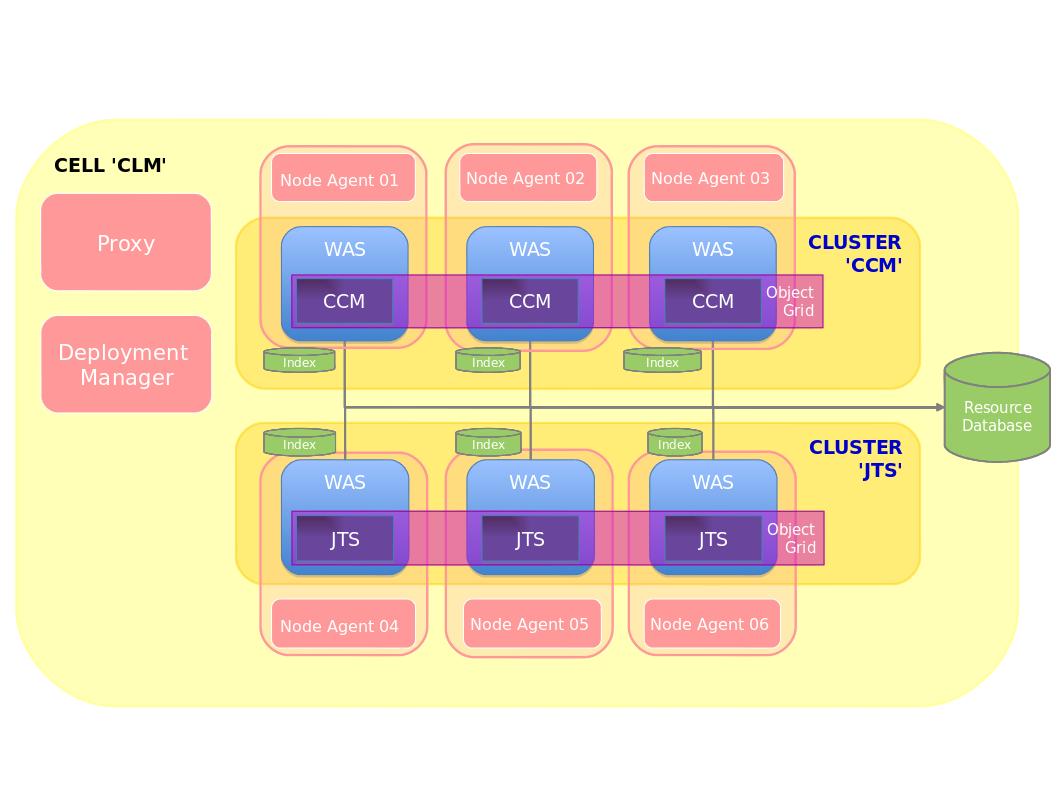
Figure 3: Distributed Cluster
2 Planning for High Availability
At the time of general availability of 4.0, a key file is needed to enable clustering. Contact IBM support to obtain key file for activating the cluster function. IBM Rational support can help you plan the right HA environment for your needs and verify the readiness of your intended cluster environment. Support will also provide early access to critical fixes for cluster deployments.2.1 Operating System and Platform
You need to ensure that you are using a supported operating system and hardware platform. If you plan to use a hypervisor, ensure that the hypervisor is fully supported. There have been performance issues with some hypervisor/OS combinations and even in the case where the desired combination is supported it is important to ensure that the nodes have dedicated access to resources allocated to them (Network, CPU and disk).
Make sure to read the latest release notes and documentation to understand what is supported. At the time of writing, Redhat Enterprise Linux, SUSE on Intel and PPC only (non-virtualized), AIX both native or on LPAR are supported. Additional platforms will continue to become available based on internal testing and early adopters. The list of supported platforms as more combinations will be updated as this occurs.
2.1.1 More about Virtualization
Some virtualized environment suffer from high latency in thread scheduling, which is very detrimental to CLM clusters (especially for distributed cache technology). This manifests in CLM as CPU starvation messages in WebSphere logs and causing CLM nodes to get disconnected from the cluster.
When running on a virtualized environments, stability can be verified in monitoring tools. We have simple tools to measure thread scheduling and network performances that can be run to validate a target environment.
Virtualized database servers are not recommended.
2.2 Node Sizing
Use the latest sizing information available for CLM 4.0 and size each node so that it is able to handle the entire workload unclustered. The reason for this is obvious as we are building a node for high-availability, If only one node remains, it should be able to handle the normal workload. (Additionally, we have found that clustering performance is only on par with a 3 node set up in this fashion. Work is still ongoing in this area).The best way to set up CLM 4.0 in unclustered mode is to do a trial run with the full user load to ensure that the hardware is appropriate for CLM 4.0 to perform within performance tolerances. If each application runs in its own cluster as in Figure 3 above, then same rule applies. Ensure that the hardware allocated to the application(s) is appropriate for the desired workload.
Once the unclustered sizing has been determined then it is best to use the exact same hardware/resource configurations for the other nodes in the cluster. At this time, we recommend 3 nodes, so this is how many identical hardware/resource sets would be needed for each node in the cluster. In effect, to use clustering you need triple the amount of hardware then if you ran the applications stand-alone!
2.3 Database Server
Clustering also has an impact on database sizing and our testing has shown that an unclustered database sizing can be insufficient in a clustered configuration. In particular, we have found disk I/O to be a limiting factor as there are now three nodes competing for the same database resources. It is important to monitor disk usage and performance during peak loads to ensure that the disk is not saturated.
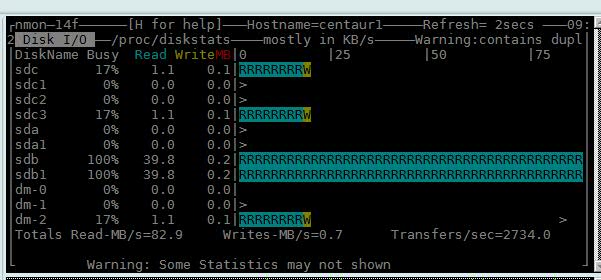
In the above configuration we have sdb1 on a SAN and sdc3 on a local disk. The SAN is quite obviously saturated so ensure that this was not the case:
- We split the CONTENTTS tablespace files across the SAN and local disk more evenly
- We increased the size of the default bufferpool
- We found out that the SAN also had a misconfiguration that were causing reads to be tremendously slow and fixed.
- We used the hdparm tool on linux, we were able to determine that buffered read were very slow
[root@centaur1 ~]# hdparm -tT /dev/sdb1
We then set some more optimal hard drive settings:
/dev/sdb1:
Timing cached reads: 16196 MB in 2.00 seconds = 8104.94 MB/sec
Timing buffered disk reads: 14 MB in 3.17 seconds = 4.42 MB/sec
hdparm -d1 /dev/sdb
This improved our HD performance almost 4x. These settings worked for this particular environment but may not be ideal for you but it shows some of the things that could be considered when examining disk I/O.
hdparm -c3 /dev/sdb
hdparm -m16 /dev/sdb
hdparm -a16 /dev/sdb
hdparm -A1 /dev/sdb
- We increased the size of the database log files as they were very small by default
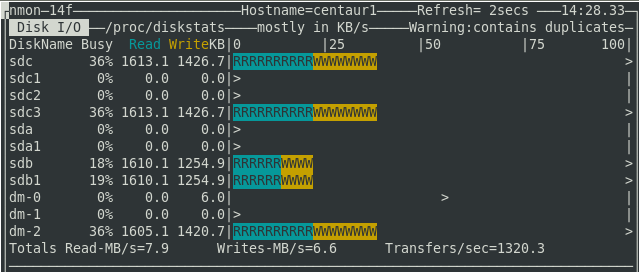
This is not a solution to all performance issues. It could have very easily been the case that the CPU was insufficient or the database was misconfigured. It happens to be the case that in our example system the disk happened to causes issues. The point is that even though the database is sufficient for unclustered configurations this may not be the case for clustered and you should careful monitor all database resources
2.4 Jazz performance indicators
To get a quick diagnosis if the cluster is operating within acceptable parameters there is a service available at this URL which will give performance information about services that are using the WXS Object Grid Cache:
https://<host>:<port>/ccm/service/com.ibm.team.repository.service.internal.counters.ICounterContentServiceThe interesting number on the page to generally determine if the cluster is operating within tolerance is average elapsed time of:
jazz.com.ibm.team.repository.service.internal.rdb.TransactionalCurrentStateCache.get(K)This value indicates the time it takes to fetch an objects from the cache. This should be 0 ms or close to it:

Figure 9: Average Cache Get Elapsed Time (in ms)
Also, for any service, if the ‘Attempts’ column contains values that are not 1 is a cause for concern. An average > 1 or a high (>2) ‘Max’ value for any row would be a bad sign as well and would require further debugging.
It is also interesting to note at the bottom of the page the grand totals for averages, this should typically be a 1 digit number normally below 5.
2.5 Network
It goes without saying that the communication between nodes and the database should be fast and with low latency. Generally it is recommended that at least a Gigabit Ethernet connection exist between all nodes and between the nodes and the database.We have determined through testing that the determining factor of good performance is the transaction rate of small packet traffic. We noticed that bad performance in this area could not only cause bad performance and general request failures, it could also hang the cluster so it is vitally important that this is within acceptable parameters. This has been the key to problems in virtualized environments, because of resource sharing, virtualized nodes (often on the same hardware) have very bad response rates to small packet traffic. Investigations are ongoing to why this is the case.
For a start, one should use a tool like “netperf” to run performance tests between nodes to determine the performance. For example, in our cluster above that was using a 1 Gigabit connection, we determined that the throughput between nodes in the cluster was:
[root@RTPCLMperf13 ~]# netperf -H 9.42.117.233 -t TCP_STREAMWe can see that the result of stream throughput for both TCP and UDP is about 1 GiB/s which is what we would expect. Now we should also take a look at latency between these nodes for small packet TCP traffic (512K):
TCP STREAM TEST from 0.0.0.0 (0.0.0.0) port 0 AF_INET to 9.42.117.233 (9.42.117.233) port 0 AF_INET
Recv Send Send
Socket Socket Message Elapsed
Size Size Size Time Throughput
bytes bytes bytes secs. 10^6bits/sec
87380 16384 16384 10.03 925.13
[root@RTPCLMperf13 ~]# netperf -H 9.42.117.233 -t UDP_STREAM
UDP UNIDIRECTIONAL SEND TEST from 0.0.0.0 (0.0.0.0) port 0 AF_INET to 9.42.117.233 (9.42.117.233) port 0 AF_INET
Socket Message Elapsed Messages
Size Size Time Okay Errors Throughput
bytes bytes secs # # 10^6bits/sec
124928 65507 10.00 18192 0 953.36
[root@RTPCLMperf13 ~]# netperf -H 9.42.117.233 -v 2 -f x -t TCP_RR -- -r 512K
TCP REQUEST/RESPONSE TEST from 0.0.0.0 (0.0.0.0) port 0 AF_INET to 9.42.117.233 (9.42.117.233) port 0 AF_INET
Local /Remote
Socket Size   Request  Resp.   Elapsed  Trans.
Send   Recv   Size     Size    Time     Rate
bytes  Bytes  bytes    bytes   secs.    per sec

16384  87380  524288   524288  10.00     100.88
16384  87380
Alignment      Offset         RoundTrip  Trans    Throughput
Local  Remote  Local  Remote  Latency    Rate     10^6bits/s
Send   Recv    Send   Recv    usec/Tran  per sec  Outbound   Inbound
    8      0       0      0   9913.153   100.876 423.105    423.105
A total throughput of 846.21 and latency of about 10 ms per transaction. As mentioned earlier our cluster with these network figures was easily able to handle close to 2000 test users over 3 nodes with disk I/O on the database disk I/O becoming the limiting factor. (The proxy also started to overload at this point which we will refer to later.)
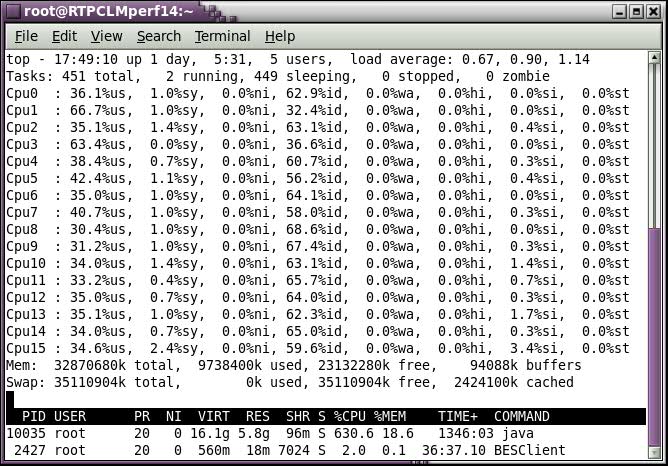
2.6 CPU
CPU utilization is an important component of network performance and a busy cluster that uses the network extensively can have a large impact on CPU utilization and vice versa. In fact, a CPU that has scheduling issues (due to virtualization or being too busy) can manifest itself in bad network latencies by not being to process interrupts in a timely fashion.The aggregate CPU utilization of a cluster that is well balanced should not exceed 90% at peak load. This needs to be taken into account in conjunction with requirement that each node has enough CPU power to not only handle its own load but that of the combined load of all nodes. So this means that when only one node is active it should not go beyond 90% at peak load. Not doing so may cause users requests to fail during node failures and may cause general instability.
The “top” tool can be used to measure performance. These are the results from our test cluster under 2000 user load:
 |  |
| Figure 6: Node 1 CPU Utilization | Figure 7: Node 2 CPU Utilization |
 | |
| Figure 8: Node 3 CPU Utilization | |
During in-house testing we have used both WebSphere Proxy Server (WPS) and the WebSphere Plugin in conjunction with IBM HTTP Server (IHS). Though WebSphere Proxy Server does work admirably in most situations, we have found the IBM HTTP Server/Plugin combination able to handle throughput more efficiently (less memory) and balance load more evenly.
(It also happens to have many more configuration options in this regard and is generally thought of as being more secure as it is able to run on privileged ports as an unprivileged user. Most high availability documentation available uses HTTP Server as the proxy. )
If using IHS/Plugin or WPS, it is important to ensure that the proxy server is configured so that it is able to handle the incoming request load (in our scenario it was 2000 simultaneous requests) from a memory and processing power perspective. Generally speaking, one HTTP request into the CLM application takes approximately 25M of memory on the proxy server. Therefor, the capacity of the proxy is usually limited by the memory. Once this limit is understood then IHS needs to be configured to perform within these limits.
In our in house test we found that after we resolved the issue related to database disk I/O previously mentioned, that the proxy became the next bottleneck. The proxy simply was unable to handle the load and started dropping requests. We subsequently tuned the IHS proxy to make better use of the machine’s memory. As we were using Linux, we added the lines below into files envvars under /opt/IBM/HTTPServer/bin to increase the limits in the size of the stack and the maximum number of user processes:
ulimit -s 512Added the following in the file limits.conf under /etc/security, as root so that users can set the max processes ulimit value:
ulimit -u 65536
* hard nproc 65536In httpd.conf
* soft nproc 65536
ThreadsPerChild = default settingChecked the following kernel values and make sure they are big enough for the number of user processes/threads (>65536 in this case):
ServerLimit <= (Physical RAM)/25M, when c is determined set ServerLimit = MaxClients/ThreadsPerChild
MaxClients = Minimum of ThreadsPerChild * ServerLimit or 2000 (or user test limit)
cat /proc/sys/kernel/pid_maxThis is very specific to our particular load test (2000 users) but should show that the default proxy configuration is often not adequate enough to handle large user loads and will require some degree of tweaking to be able to handle the load according to the machine specifications.
cat /proc/sys/kernel/threads-max
This is another reason why we recommend to use a load balancer and multiple proxy servers: to better distribute the load across proxy servers and increase the request throughput.
3 Deploying High Availability
There are a few scenarios which may be followed depending on the situation. In any case, you will need the following:- Proper planning and sizing should be done for nodes, databases and proxies and there should be fast low latency connections between all machines (as per recommendations in 2).
- WebSphere Application Server – Network Deployment Edition 7 or 8
- Including the supplements which includes IBM HTTP Server and WebSphere Web Server Plugins
- WebSphere eXtreme Scale 7.1.1.1 (plus latest fixpacks)
- WebSphere Edge Components Load Balancer v8.0 (or functional equivilent)
- An Network Time Protocol (NTP) Server for node time synchronization. All node clocks must be correctly synchronized. This is true for any good cluster deployment in general, but especially true for CLM deployments. Time affects authentication protocols (OAuth) among other things.
- DB2 9.7 HADR / Oracle 11g RAC / SQL Server 2008 R2 Cluster as RDBMS
- IBM Installation Manager is assumed to be installed on all hosts that have the deployment manager, a proxy server or cluster node
- IBM Update Installer for WebSphere Software to install WebSphere eXtreme Scale FixPack on all hosts that have the deployment manager, a proxy server or cluster node.
The following diagram show a topology for a Level 4 deployment of CLM. The information center installation instructions for CLM build toward this topology (except for the standby load balancer and database).
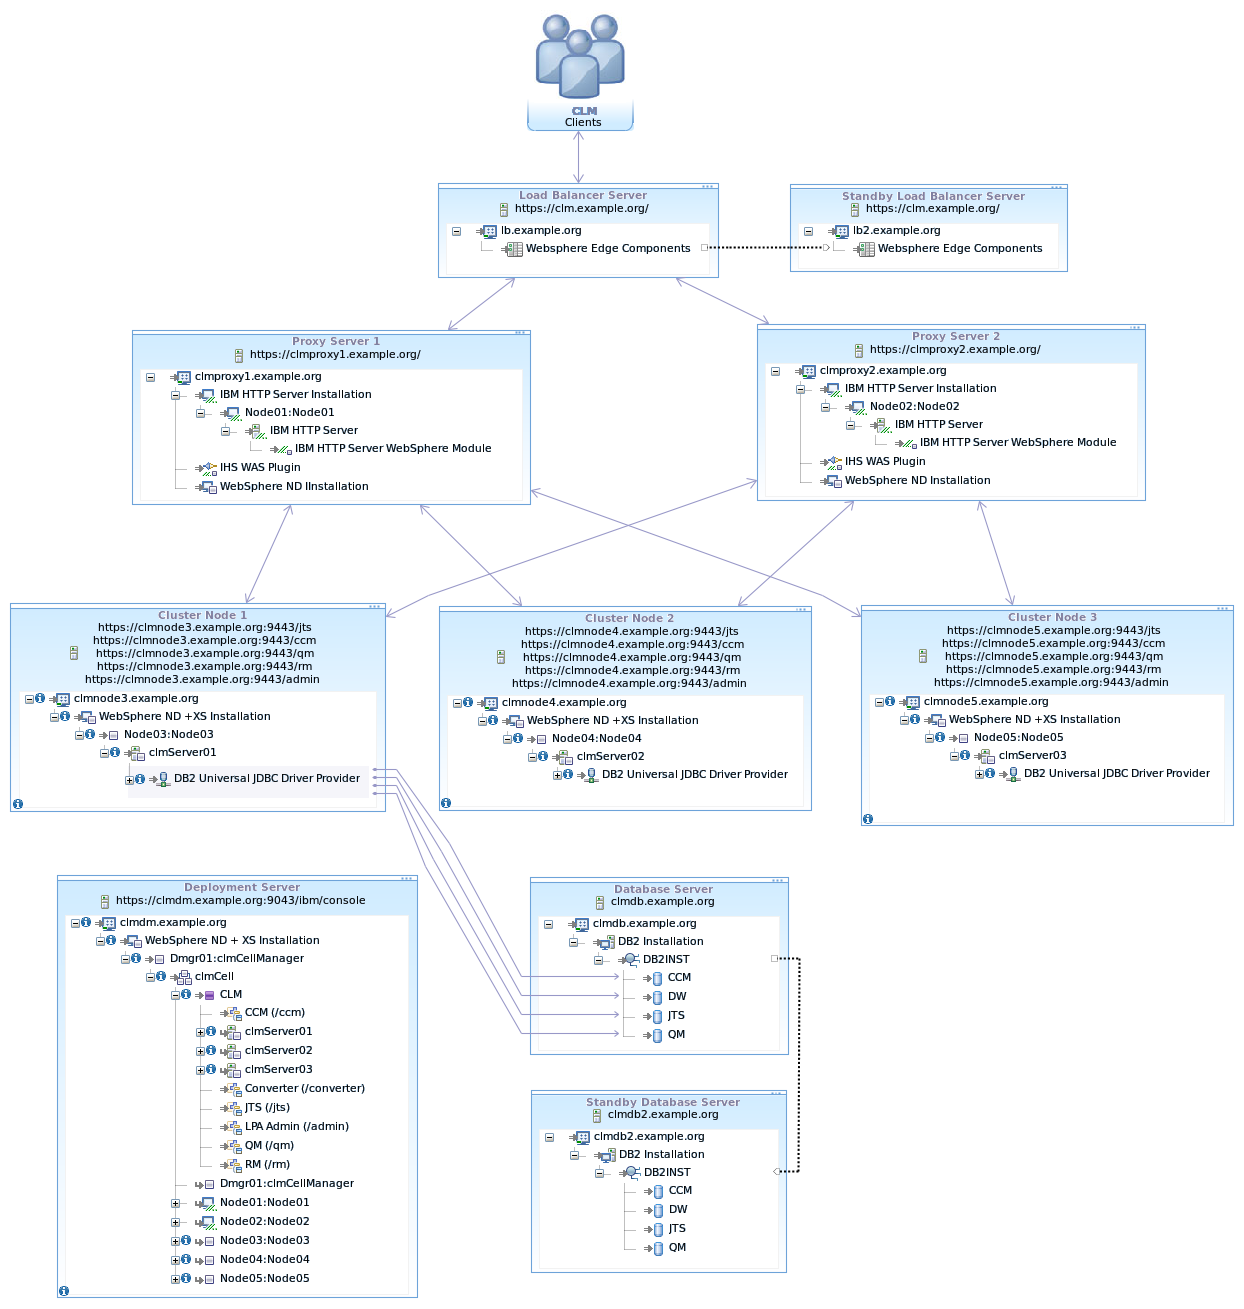
The WAS ND configurations involves building a cell in the Deployment Manager that will contain all the elements, clusters, nodes, applications server, cluster members and anything else that is related to configuration of the applications (such a LDAP authentication). The diagram below show the cell configuration for the topology above.
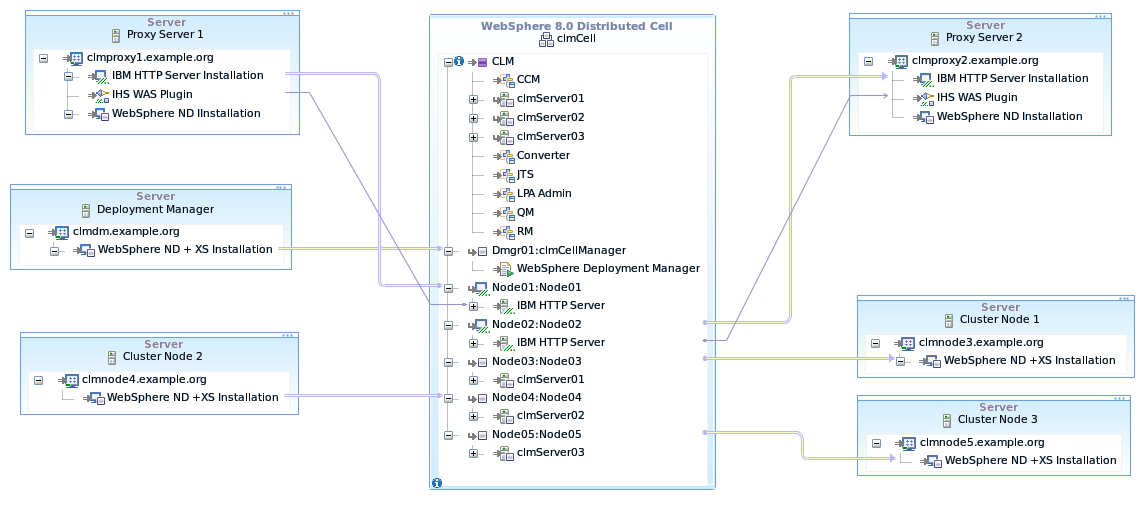
Figure 10: WebSphere Cell Configuration

Figure 11: WebSphere eXtreme Scale Topology
3.1 Upgrading from CLM 3.x
Before attempting to enable clustering it is generally recommended to upgrade the CLM 3.x deployment as usual unclustered first before attempting to cluster. There are some deviations from the standard procedure that can be done to save time depending on the scenario. In particular, as the CLM 3.x topology is either using tomcat or standard WebSphere Application Server, then there is no need to re-install the CLM applications into those applications servers as they will need to be installed into WebSphere Application Server – Network Deployment Edition (WAS ND).The flow to follow is:
- Install the full WAS ND topology as specified here including node members, proxies and any load balancers as required. As specified in the instructions verify the topology using the Default Application ensuring that it is accessible directly and through proxies and load balancers
- Upgrade the CLM 3.x to 4.x using IBM WebSphere Application Server in the Upgrade guide

- After the step where asked to uninstall the 3.x application from the WebSphere Application Server do not re-install the applications into WebSphere Application Server. (In the case of Tomcat nothing needs to be done here.)
- If you have WebSphere Application Server Standard edition installed, uninstall it and clean out all the directories.
- A stand-alone unclustered version of CLM will either become a node in a cluster, a deployment manager (or both) or be retired completely. When following the installation instructions for clustering, it will ask that CLM 4.0 be installed on the deployment manager.
- In the case where the old unclustered node will become the deployment manager, then CLM 4.0 will already be installed (and upgraded, except the .ear files) and it will not need to be re-installed.
- If the current unclustered installation will not be the deployment manager or be retired completely then a new copy of CLM 4.0 should be installed on the deployment manager (as per the Information Center clustering instructions). After the installation is complete it is necessary to copy over the <jazz team server> directory (or directories if there are separate applications) from the old node to the new deployment manager. It should be copied over the new installation replacing the new installed files with the ones from old unclustered node!
- Once the topology is set up and it has been decided how the old unclustered hardware will be used (or not), then the CLM 4.0 clustering instructions can be followed to completion. Please note the following
- As part of the upgrade process you may need to run the application unclustered to complete the upgrade. Use the pre-cluster application server used for the server template to complete these steps in the same way that JTS setup is run.
- If you install each application on its own application server, then you will need to create a server definition for each application. These will be basis of the server templates for the clusters.
3.2 New installation of 4.x
Complete instructions on how to install a new CLM 4.x cluster can be found here. The basic flow is as follows:
- Install the full WAS ND topology as specified here including node members, proxies and any load balancers as required. As specified in the instructions verify the topology using the Default Application ensuring that it is accessible directly and through proxies and load balancers
- Install CLM into the WAS ND environment found here
3.3 RRDI Installation
RRDI instructions for clustered installation can be found here. An RRDI installation must be installed into a separate cluster from CLM. It is also desirable to have RRDI nodes not share the same nodes as CLM due to resource contention. It is not desirable to have report execution effect the operations of a CLM cluster.
4 Common Cluster Operations
4.1 Moving from clustered to unclustered (and back)
Once a cluster is set up, it is possible to easily move it into an unclustered state with few operations. Things like the server rename feature require this, for example, and it can also be useful for determining environmental issues.
To uncluster:
- Choose a node, lets call it clmnode1 in a 3 node cluster (with clmnode2 and clmnode3 being the other nodes) to be the unclustered node.
- Shutdown the entire cluster
- Go into the cluster definition on WebSphere deployment manager and set the weights of the cluster members on clmnode2 and clmnode3 to “0” as per the instructions found here.
- On clmnode1:
- copy the $JAZZ_HOME/jts/teamserver.properties to $JAZZ_HOME/jts/teamserver.properies.clustered
Edit $JAZZ_HOME/jts/teamserver.properties and comment out:
#com.ibm.team.repository.cluster.gridName=JTS_Grid
- copy the $JAZZ_HOME/ccm/teamserver.properties to $JAZZ_HOME/ccm/teamserver.properies.clustered
Edit $JAZZ_HOME/ccm/teamserver.properties and comment out:
#com.ibm.team.repository.cluster.gridName=CCM_Grid
- copy the $JAZZ_HOME/qm/teamserver.properties to $JAZZ_HOME/qm/teamserver.properies.clustered
Edit $JAZZ_HOME/qm/teamserver.properties and comment out:
#com.ibm.team.repository.cluster.gridName=QM_Grid
- copy the $JAZZ_HOME/rm/fronting.properties to $JAZZ_HOME/rm/fronting.properties.clustered
Edit $JAZZ_HOME/rm/fronting.properties and comment out:
#com.ibm.team.repository.cluster.gridName=RM_Grid
- copy the $JAZZ_HOME/admin/admin.properties to $JAZZ_HOME/admin/admin.properties.clustered
Edit $JAZZ_HOME/admin/admin.properties and comment out:
#com.ibm.team.repository.cluster.gridName=LPA_Grid
- copy the $JAZZ_HOME/jts/teamserver.properties to $JAZZ_HOME/jts/teamserver.properies.clustered
- Now restart the application server on clmnode1. It should now be unclustered.
To re-enable clustering:
- Shut down the cluster member/application server on clmnode1
- On clmnode1:
- copy the $JAZZ_HOME/jts/teamserver.properties.clustered to $JAZZ_HOME/jts/teamserver.properies
- copy the $JAZZ_HOME/ccm/teamserver.properties.clustered to $JAZZ_HOME/ccm/teamserver.properies
- copy the $JAZZ_HOME/qm/teamserver.properties.clustered to $JAZZ_HOME/qm/teamserver.properies
- copy the $JAZZ_HOME/rm/fronting.properties.clustered to $JAZZ_HOME/rm/fronting.properties
- copy the $JAZZ_HOME/admin/admin.properties.clustered to $JAZZ_HOME/admin/admin.properties
- Change the weights of clmnode2 and clmnode3 to their original values (probably “2”)
- Start the cluster.
4.2 Rebalancing nodes
It may not be feasible in some cases to have all nodes identical and one may be weaker then the others. If this is the case you will see that one node has a higher CPU utilization then others (using a tool like “top’) simply due to the fact that it has less overall CPU power. If this weaker node is still able to handle the full load this is fine and it would be better if we could even out the CPU utilization across all the nodes. This can be accomplished using cluster weight described here.
For example, if one node, clmnode1 of a 3 node cluster (with clmnode2 and clmnode3 being the other nodes) is twice as utilized as the other nodes then the weights of the cluster members should be set as follows:
clmnode1: 2
clmnode2: 4
clmnode3: 4
Looking at the Active Services int the JTS Admin page can also help to determine how many services each node is running:

4.3 Online Database Backups
Each RDBMS has its own method for performing online backups (for DB2 look here to start) so the high level process will be covered here rather than the details. Backups for cluster are identical to that of a standard CLM 4.0 unclustered distribution. This topic is a candidate for an article on it’s own but as it has not been covered to the best extent possible so high level instructions will be provided here as a first step:
To Backup:
- Back up the DW first as this can always be updated using a subsequent ETL after restore.
- Take a DW backup and gather all the files and logs.
- Then start an online database backup of all the databases, CCM, JTS and QM
- Each backup of CCM, JTS and QM will finish at a different time, the largest database finishing last.
- Take note of the time of the online backup that finishes last. ( of CCM, JTS and QM)
- Collect all the logs for the each database between the time it finished and the time the backup of the largest database finished.
- The online backup file for each database along with the logs up to the time the last database finished the online backup constitute a backup of CLM.
To Restore:
- Restore the CCM, JTS and QM databases
- Roll forward each database to the time of the last completed back up.
- Restore the DW (also roll forward)
- Run ETLs
4.4 Changing Jazz Properties
The jazz properties are kept in synchronization between the nodes so it is inadvisable to edit the teamserver properties files by hand other then in exceptional circumstances. If, for whatever reason, it is necessary to change teamserver.properties, fronting.properties or admin.properties by hand then the following procedure should be followed:
- Stop the entire cluster
- Change the property files on one node
- Copy the property files (or the entire jazz team server installation directory) to all the other nodes in the cluster
- Start the cluster
Failure to follow these instructions will cause nodes to fail to start up.
Links used in this article:
- Standard CLM Topologies
- Pacemaker
- Scalable, Integrated Solutions for Elastic Caching Using IBM WebSphere eXtreme Scale Redbook
- WebSphere Application Server Network Deployment V6: High Availability Solution Redbook
- System Requirements for Rational Team Concert 4.0, Rational Quality Manager 4.0, Rational Requirements Composer 4.0 (and Jazz Foundation 4.0 and Rational Reporting for Development Intelligence 2.0)
- JazzMon – Seeing what your server is up to
- WebSphere Application Server – Network Deployment Edition
- WebSphere eXtreme Scale
- WebSphere Edge Components Load Balancer
- Network Time Protocol (NTP)
- IBM Installation Manager
- IBM Update Installer for WebSphere Software
- CLM Jazz.net Update Article
- CLM 4.0 Information Center
- CLM Clustering Configurations with WebSphere eXtreme Scale
Copyright © 2012 IBM Corporation