JRS Reporting to calculate state history for Work Item 7.0.2
|
Hi,
I saw some of the older posts suggesting to use workitem history to create such a reports. Nobody has commented they are successful in achieving that.
My use case is to calculate the calculating the number of workitem residing in the same state from how many days of the previous state. Similar way I need to do for all state in a single JRS report.
Any solution leads would be helpful
|
One answer
|
David Honey (1.8k●1●7)
| answered Feb 17 '23, 9:27 a.m.
FORUM ADMINISTRATOR / FORUM MODERATOR / JAZZ DEVELOPER edited Feb 17 '23, 9:28 a.m.
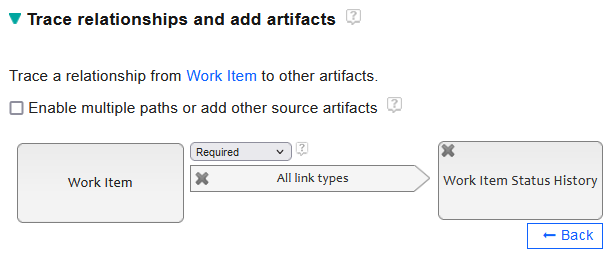
Look at reports using the Work Item Status History. That records changes to a work item status, its previous state, how many days it has been in that state and so on. You might want to use a traceability path from work item to work item status history so that you can set conditions on the work item:
Comments Thanks. I was trying with historical trends to build a graph on number of workitems present in that state against number of days. Can you tell me when to use Historical Trends vs Current Data ?
Historical trends is used when you want to spot trends over time. For example, have a graph of the number of closed versus open work items over some time period. In other words where the X-axis represents time.
It sounds like the graph you are trying to implement does have time as its X-axis. This sounds more like a counting type of report.
Yes . I am trying to calculate number of defects against each development team how much days they are taking to move/close the defect in a graph so that the management can decide where exactly the delay..
New -> In Progress -> Review -> Closed
|
Your answer
Dashboards and work items are no longer publicly available, so some links may be invalid. We now provide similar information through other means. Learn more here.
Comments
Is this for reporting against Data Warehouse or against Lifecycle Query Engine?
I am using Data warehouse