Jazz Report Builder shuffles the bars in a bar chart
|
If I create a report using the Report Builder I make my selections using the wizard and get a couple of columns in a bar chart, one is called "Planned Work" and the other is called "Actual Work". On the "Format Results" page's "Format" panel I can see these two bars in their bar chart. I then go to the Advanced section of the "Format Results" page and edit the SQL to get a third bit of data called "Monday". The "Validate Query" button is happy with my SQL statement. Back on the "Format Results" page's "Format" panel I can now see three bars : "Planned Work" = 189 hours, "Actual Work" = 84 hours and "Monday" = 14 hours. Which is all as expected. But if I select "Run Report" I get "Monday" = 189 hours, "Actual Work" = 84 hours, "Planned Work" = 14 hours. Does anyone know why it has mixed up the results ? |
One answer
Your answer
Dashboards and work items are no longer publicly available, so some links may be invalid. We now provide similar information through other means. Learn more here.
Comments
I am still seeing this problem so I was wondering if anyone had any ideas.
I am using the "VW_TIMESHEET" and "VW_REQUEST" views to get information on the work done for a particular Timeline Iteration.
If I use the Report Builder, make some selections and then do some editing of the SQL I get the information I require.
On the "Format Results" tab I have a bar chart with four bars :
Coding Hours = 22, Documentation Hours = 2, All worked hours = 48, Investigation Hours = 24
This is what I expect to see.
But when I "Run Report" / Graph View I get :
Documentation Hours = 48, All worked hours = 22, Coding Hours = 2 , Investigation Hours = 24
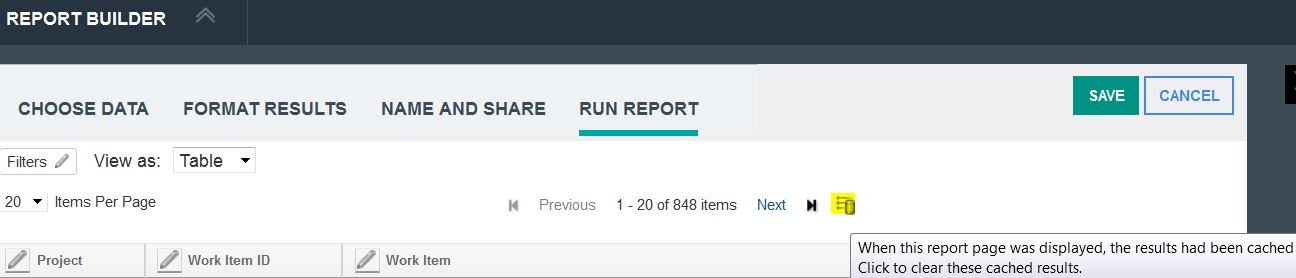
After a couple of minutes I cleared the cache and did as "Run Report" / Graph View again. This time I got :
Investigation Hours = 48, Coding hours = 22, Documentation Hours = 2 , All worked Hours = 24
And, of course, when I publish the report and display the widget (view as Graph) on the dashboard it shows these erroneous values.
P.s.
The "Run Report" / Table View is ok. I.e.
Coding Hours column adds up to = 22, Documentation Hours = 2, All worked hours = 48, Investigation Hours = 24
Has anybody got any clue what's going on ?
Just wondering if anyone's got any ideas about this problem I've been seeing where the bars in my Jazz Report graph get mixed up.
I drew a pretty picture to illustrate the problem described in my earlier posts but unfortunately I'm not allowed to post images because I am new to the forum.
But in a nutshell, everything looks fine in the "Format Results" window but when I hit "Run Report" the bars get mixed up. e.g. I've done 22 hours coding and 2 hours documentation but when I hit the "Run Report" button it shows coding = 2 hours.
Thanks Peter
One more bit of information :
If I select "Run Report" and then View as = Table the results are good.
e.g. I am expecting two hours of documentation and 22 hours of coding and I can see these rows in the table.
But when I select "Run Report" and then View as = Graph I get a Coding Bar = 2 and a Documentation Bar = 22