It's all about the answers!

Ask a question

How to generate graphical report based on views in DNG using JRS?


Krunal Gaoli (67769) | asked Sep 26 '17, 1:52 a.m.
edited Sep 26 '17, 1:14 p.m.

 Hi Team,


My use case is that I wanted to generate a report showing Number of Requirement not implemented by task.
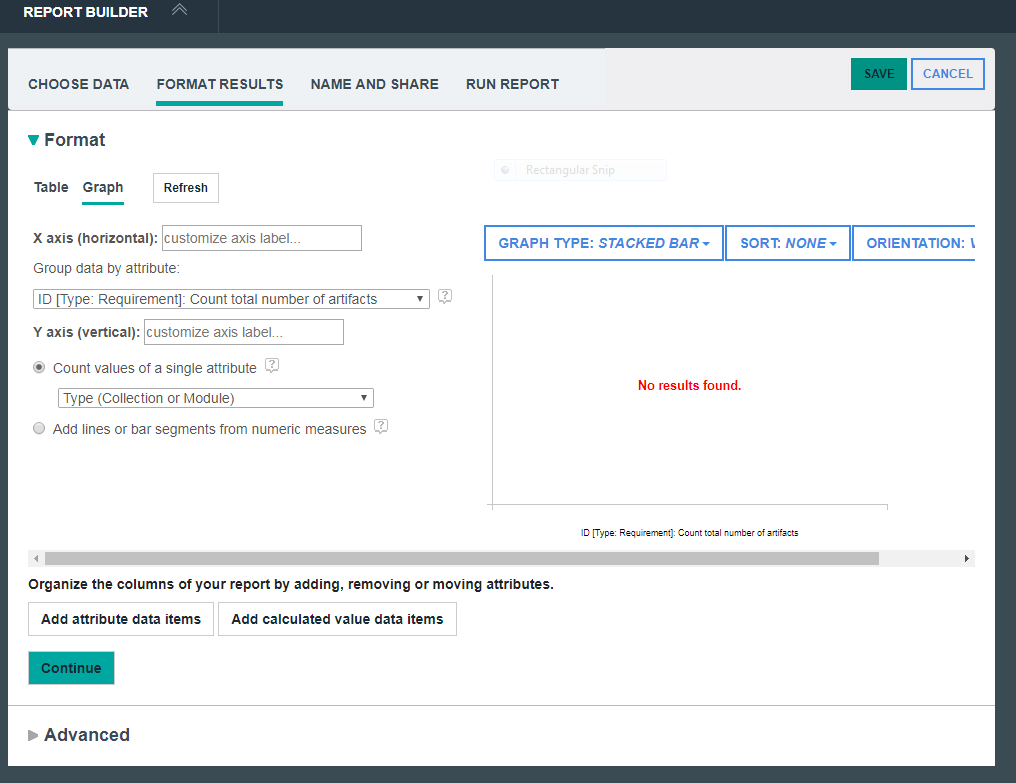
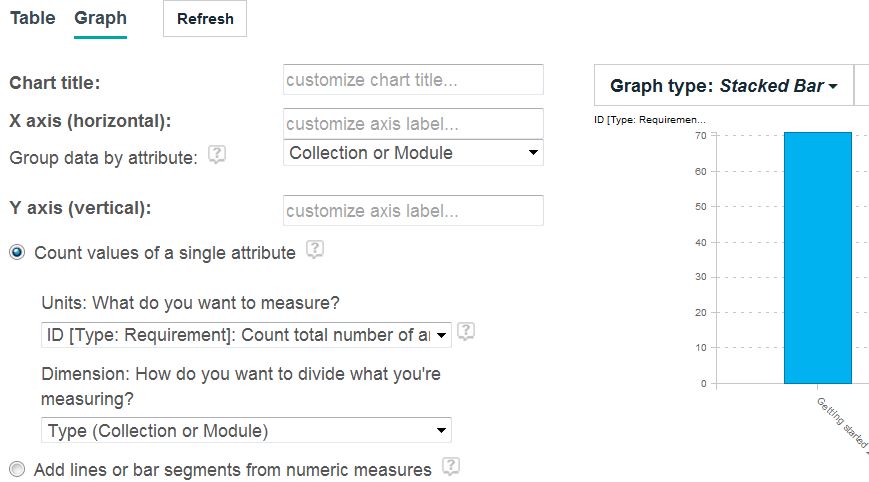
I have created a view for it and show it on dash board using widgets, but my widget is not showing the count in graphical format e.g. Bar Graph.

Please suggest how to achieve the same.

Regards,
Krunal.

2 answers


permanent link
Krunal Gaoli (67769) | answered Sep 28 '17, 3:57 a.m.

 Hi kenji,


Thanks for the reply,
I have followed the steps suggested, but I am not getting relsult out of it.

Please refer below image. Graph not showing any thing


Comments
Kenji Sarai commented Sep 28 '17, 10:10 p.m.

Try to find where the problem is

1. Change attributes for X-axis and Y-axis

2. Change to Table format report

3. Change settings in Choose data (eg condition, project ...)

4. Ensure DCC job has finished successfully

If data appears, this is where problem is. Need to elaborate here.


permanent link
Kenji Sarai (96029) | answered Sep 27 '17, 10:14 p.m.

Hi Krunal,

I think it is possible by following steps in JRS.
1. In Choose an artifact, select Collection or Module > View
2. In Trace relationship, add a link from Collection or Module to Requirement
3. In Format, click on Calculated value data item, select Requirement with "Count number of artifacts"
4. Select Graph, select graph type (bar graph), and set X-axis (eg, module or project) and Y-axis (number of artifacts)

The result is something like below
graph

Your answer


Register or to post your answer.


Dashboards and work items are no longer publicly available, so some links may be invalid. We now provide similar information through other means. Learn more here.