It's all about the answers!

Ask a question

it is possible that the stacked bar this not worked in JRS 5.0.2 with a custom query?


1
1
Iciar Matilde Olocco y Garcia (731520) | asked Jun 22 '15, 1:07 a.m.
Hi everyone!

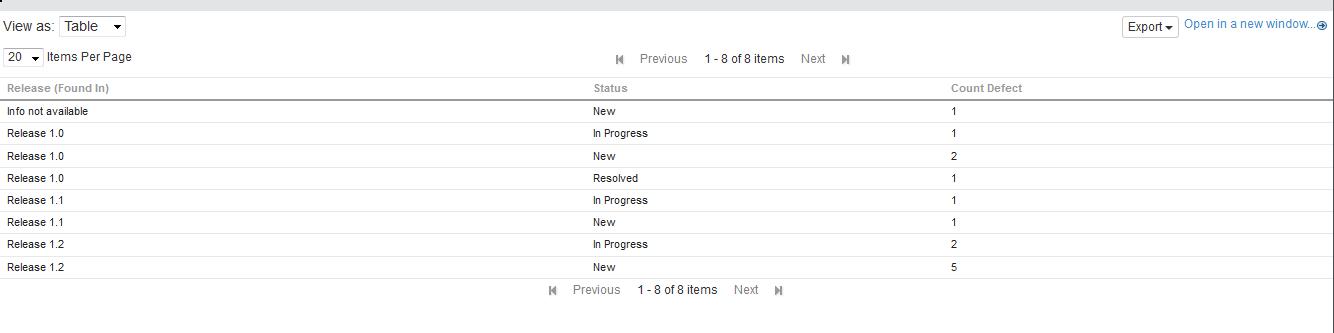
I've worked in JRS 5.0.2 with RTC 5.0.2.
I've created a query "All Defects Per Release" with 3 columns:
-  Release (Found In)
- State
- Count Defect
There query has this condition =>Group By Release(Found I),  State
You can see the table

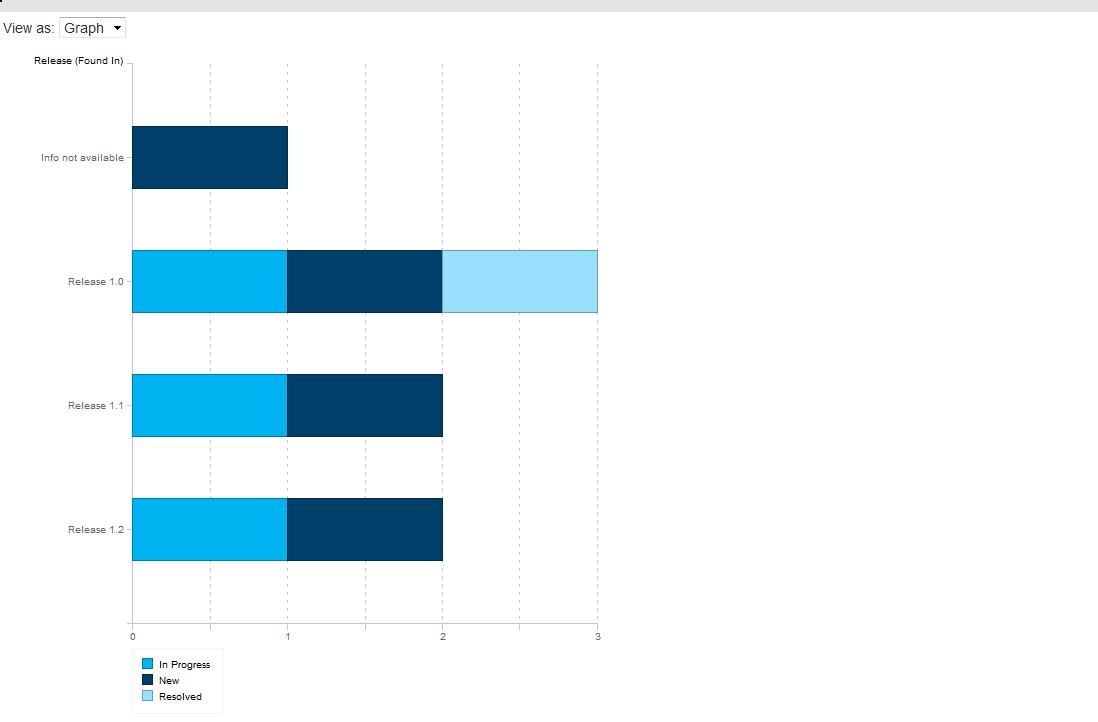
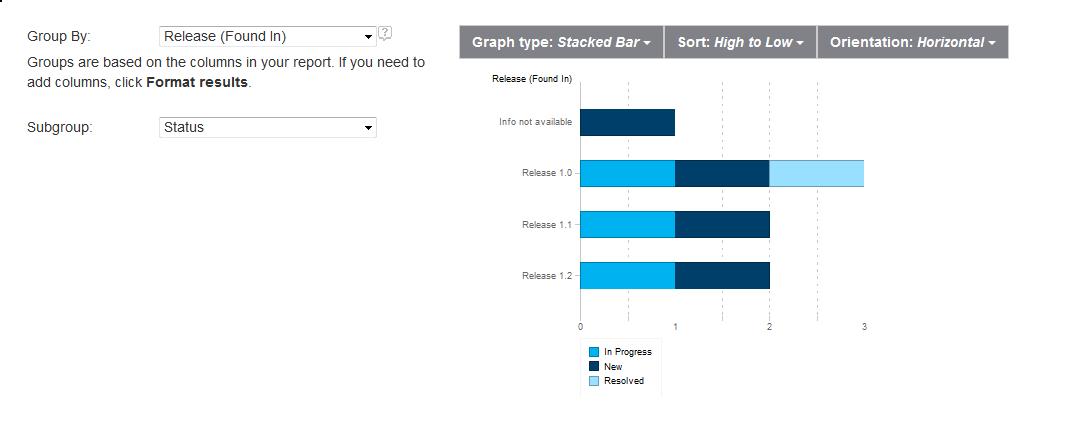
Now you can see the Graph


But when you edit the graph


You can not select the 3rd parameter (as you can see in this article: https://jazz.net/library/article/1489)

We don't select the numeric value for subgroup or group.

Could you help me?
Thanks a lot!


Comments
Francesco Chiossi commented Jun 22 '15, 2:36 a.m.

Hello Iciar,

do you get any error message when you try to upload the screenshot?
If no message or anything that is not about needed reputation, I suggest trying with a different browser.

Best Regards,

Francesco Chiossi


Iciar Matilde Olocco y Garcia commented Jun 22 '15, 7:38 a.m.

the problem is the reputation => "sorry, file uploading requires reputation >60"


Francesco Chiossi commented Jun 22 '15, 7:47 a.m.

Could you try again? You should have enough reputation now.


Iciar Matilde Olocco y Garcia commented Jun 22 '15, 8:18 a.m.

Graph 1
Table for Defect
Graph 2
Graph for Defect

Graph 3
Graph for Defect v2

I've pasted the screenshot in order by I've explained the problem
Thanks!

Accepted answer


permanent link
Darren Coffin (1823) | answered Jun 22 '15, 9:56 a.m.
JAZZ DEVELOPER
Hi Iciar.  A couple things are happening.

1. The stacked bar graph only accepts 2 parameters in version 5.0.2.  The group and the subgroup.  So your screenshots show the correct behaviour.

2. It looks like one of the screenshots from the jazz.net article that you linked is showing a combo box that is not exposed in version 5.0.2.  It looks like it was taken from a development build.  That third combo box defines how the group and subgroup are displayed.  In the screenshot in the article, it is set to "Count # of rows"...which is what is always used in 5.0.2 anyways, so that field was obscured.  I will contact the author and ask that he replace that screenshot with the GA of 5.0.2. 
Iciar Matilde Olocco y Garcia selected this answer as the correct answer

Comments
1
Iciar Matilde Olocco y Garcia commented Jun 22 '15, 10:16 a.m.

Thanks Darren, but that functionality will be available in another version?
And how to show the 3rd column in report? I see that now it is a limitation, isn't it?
Thanks a lot.


Darren Coffin commented Jun 22 '15, 10:35 a.m.
JAZZ DEVELOPER

You can show more columns in the report in a table report.  But the graph report will only display 1 column on the X-axis for a regular bar graph type report(with a count of # of rows on the Y-axis), or 2 columns for a stacked bar report (one being the X-axis, the other being which artifact type will be counted on the Y-axis and divided into coloured sections).

One other answer


permanent link
Iciar Matilde Olocco y Garcia (731520) | answered Jun 22 '15, 1:12 a.m.
I can not paste the screen shot :( Please if some can help me I can send it the screenshot

Your answer


Register or to post your answer.


Dashboards and work items are no longer publicly available, so some links may be invalid. We now provide similar information through other means. Learn more here.