How does the execution trend report determine the computed values?
|
The sample execution trend report appears to pick arbitrary values for the computed attempted and computed completed trend lines. For example, I've created 4387 TCERs for a given test schedule iteration:

When I create a "Execution Trend" report based on this same test schedule iteration it seems to arbitrarily set the computed values to end around 2,800: 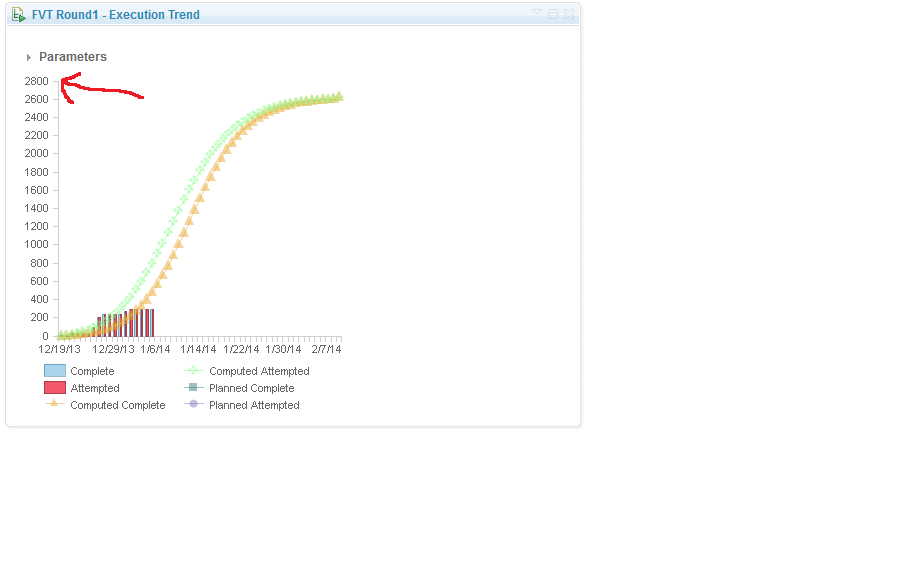
I've noticed this before and as testing progresses the trend line will adjust...but this is very poor since the whole idea is to map out if testing progress is on target...you don't want the trend line to change. Is there something I'm missing? Thank you! |
One answer
Your answer
Dashboards and work items are no longer publicly available, so some links may be invalid. We now provide similar information through other means. Learn more here.