It's all about the answers!

Ask a question

How to create a burndown chart table in RTC ?


Johnson David (2611416) | asked Feb 26 '13, 12:03 p.m.

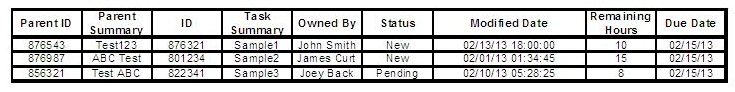
Hello Guys,

I want to create a table in burn down chart or any report, which dispalys the task,owner,status,modifed date,remaining hours,due date in a table format.

Want to know which technology to involve ?

How to customize the reports ?

or please provide me any link that will be helpful.

Please find the burn down chart table below.

2 answers


permanent link
James Moody (3.3k24) | answered Feb 27 '13, 10:44 a.m.
JAZZ DEVELOPER
Yes, please start by looking at the Work Item query capabilities, that may give you much of what you're looking for. The table you show above doesn't look like a burndown chart to me - a burndown is usually an over-time representation that shows a historical trend. Have you looked at the out-of-the-box Burndown report that comes with RTC? If that's close to what you want you may be able to modify it to achieve your goals. For extensive reporting customization, I would recommend looking at RRDI, but first make sure you've exhausted the possibilities of the out-of-the-box capabilities.

Comments
Johnson David commented Feb 27 '13, 12:36 p.m.

Thanks..James,

May i know how to get to the out of the box burndown chart in RTC ?


James Moody commented Feb 28 '13, 4:22 p.m.
JAZZ DEVELOPER

Sure - If you just want to run it, it should be deployed automatically in your project area (assuming you are using Scrum as your process template in your project) so you can run it by going to the Reports web ui and finding it there.


If you want to customize it using BIRT, it's probably not the best example to start with, as it's a pretty complicated report. We do ship the source in your RTC client, in the plug-in folder for "com.ibm.team.examples.reports.common". These files can be imported into your workspace to modify with BIRT.


permanent link
Vladimir Amelin (70472226) | answered Feb 27 '13, 1:25 a.m.

It dosen look like chart) Such table can be generated by using simple work item query (with option of csv export).

As for reporting, BIRT is enough fir such report on Live data. I would suggest looking at out-of-the-box reports first to re-design them instead of creating new template from scratch. Another option s RRDI\Insight. But still try using built-in query functionality first.


Comments
Johnson David commented Feb 27 '13, 12:35 p.m.

Thanks..Vladimir,

May i know how to use the CVS export option in RTC ? I created a simple query but didn't find a CVS option.

And also, where to find the out of box reports in RTC ?

Thanks in advance


Johnson David commented Mar 04 '13, 8:15 a.m.

Hello Vladimir,

I could install BIRT in my machine. But i need a tutorial or link to specifically on displaying table(with contents) in the report ?

Can you please help  ?

Thanks..Johnson


Your answer


Register or to post your answer.


Dashboards and work items are no longer publicly available, so some links may be invalid. We now provide similar information through other means. Learn more here.