| Burndown Charts |
 |
|
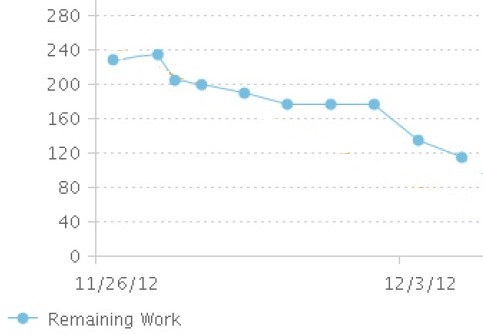
This is an example burndown chart.
A Sprint Burndown Chart shows daily progress. A Release Burndown Chart shows progress towards the planned work for a
release. A Product Burndown Chart displays progress relative to the entire product
backlog. |
Licensed Materials - Property of IBM |