| Test Execution Status |
Purpose
This metric helps a team understand overall solution quality by studying two factors: test completeness and test
success. The test completion rate enables the team to manage what part of the test effort remains, including the risk
associated with potentially undiscovered quality issues. The test success rate helps the team to decide whether the
software or system is working correctly. This metric should be used in conjunction with the Defect Trends metric (see
Defects) to determine release readiness of the solution. When the term "test" is used in this metric, it refers to the executable tests that contain the steps needed to run against the actual solution under development. These tests can be manual or automated. The Rational Unified Process refers to these tests as "test scripts", but in some test methodologies and test tools, these are referred to as test cases. To avoid confusion, this metric uses the term "test." DefinitionTest Execution Status is measured by reporting the following items once per iteration and trending throughout the release cycle:
Terms Tests planned = The number of tests scheduled to be executed in the iteration. Tests implemented = The number of tests built and ready to be executed - both manually and automatically - in the iteration. Tests attempted = The number of tests that have been executed, and is the sum of the passed, failed and blocked tests. Passed tests = The number of tests that have a most recent result of pass. Failed tests = The number of tests that have a most recent result of failed. Blocked tests = The number of tests that cannot be executed completely to the last step of the test. For manual tests, this means the tester could not execute all the steps of the test. For automated tests, the automated testing tool reports a passing result, but the human test analyst determines that the test was invalid using information outside the scope of what the automated testing tool can report.
Build Health is captured in IBM® Rational® Team Concert® and BM® Rational® Insight®. AnalysisUse either a line or bar graph that shows number of tests on the y-axis and the iterations along the x-axis. Categorize the tests as indicated above. Ideally, show the results against a planned schedule for implementation and successful execution. The following patterns might occur: Rising slope
Hockey stick
Reverse hockey stick
Alternative Tracking MethodsS-CurveThe x-axis of the S curve represents time units and the y-axis represents the number of test cases or test points. By "S-curve" we mean that the data are cumulative over time and resemble an "S" shape as a result of the period of intense test activity, causing a steep planned test ramp-up. For the metric to be useful, it should contain the following information on one graph:
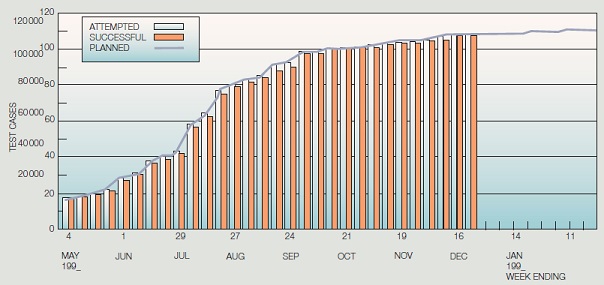
As seen from the figure below, the testing plan is expressed in terms of a line curve, which is put in place before the test begins. The lightly shaded bars are the cumulative number of test cases attempted, and the red bars represent the number of successful test cases. With the plan curve in place, each week when the test is in progress, two more bars (one for attempted and one for successful completion) are added to the graph. This example shows that during the rapid test ramp-up period (the steep slope of the curve), for some weeks the test cases attempted were slightly ahead of plan (which is possible), and the successes were slightly behind plan.
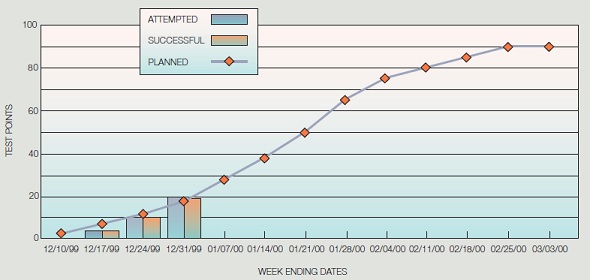
Test PointsTo track test points, the teams need to express the test plan (amount of testing done every week) and track the week-by-week progress in terms of test points. The figure below shows test point tracking for a product level test, which was underway, for a systems software. The weights and the resulting test scores should be determined in the testing planning stage and remain unchanged during the testing process.
TablesAlthough the figures above give a quick visual status of the progress against the total plan and plan-to-date (the eye can quickly determine if testing is ahead or behind on planned attempts and successes), it may be difficult to discern the exact amount of slippage. For that reason, it is useful to also display testing status in tabular form, as in the table below.
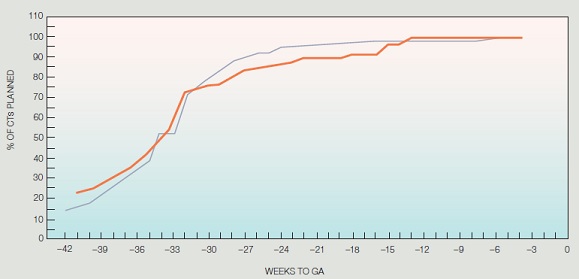
The table also shows underlying data broken out by department and product or component, which helps to identify problem areas. In some cases, the overall test curve may appear to be on schedule, but because some areas are ahead of schedule, they may mask areas that are behind when progress is only viewed at the system level. Release-to-Release ComparisonFor release-to-release comparisons, it is important to use weeks before product general availability (GA) as the time unit for the x-axis. By referencing the GA dates, the comparison provides a true in-process status of the current release. In the figure below, we can see that the release represented by the red, thicker curve is more back-end loaded than the release represented by the blue, thinner curve. In this context, the metric is both a quality and a schedule statement for the release, as late testing will affect late cycle defect arrivals and hence the quality of the final product. With this type of comparison, the project team can plan ahead (even before testing starts) to mitigate the risks.
For more information, see In Process Metrics. Frequency and reportingData is captured each day and monitored at the end of each iteration to help identify trends. Collection and reporting toolsTest execution data is captured in IBM® Rational® Quality Manager®. IBM® Rational® Insight® provides an out of the box report focused on implemented tests and their status. Assumptions and prerequisites
Pitfalls, advice, and countermeasures for this metricThe following items are indicators of measurement pitfalls and should be used to corroborate this metric:
|

Licensed Materials - Property of IBM |