Development intelligence with the CLM solution
The ability to make fact based decisions is fundamental to steering a project to a successful conclusion. Dashboards and reports that surface team activity and trends from actual data provide powerful insight and transparency for making decisions. With the CLM solution all team members have access to the same data. Team members can use reports, dashboards, dashboard mashups, personal dashboards, or a mini dashboard along with a catalog of widgets for displaying a wide variety of information using out of box and custom reports and queries.
Development intelligence improves predictability by:
- Applying Business Intelligence techniques to development projects;
- Enabling fact based decisions making (to communicate status, monitor progress, diagnose problems, identify corrective actions);
- Providing transparency to help teams steer projects and programs to deliver on-time.
Shared Reporting solution
Take advantage of a common cross-application reporting solution designed to work with a set of applications that share a JTS, while sharing the same data warehouse that can be used by enterprise reporting solution.
The image below illustrates the scope of the reporting solution that comes out of the box with the solution.
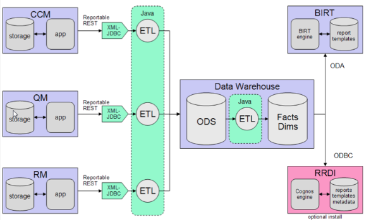
Common data warehouse for reporting
The CLM solution uses a common data warehouse where linked data from across the CCM, QM and RM applications are stored. You’ll first meet this data warehouse in the server setup wizard:
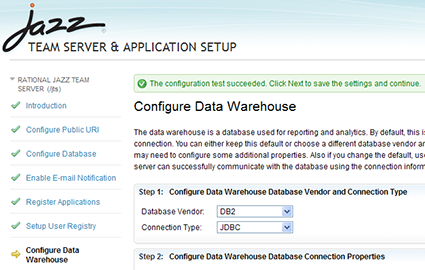
Management of the data collection jobs which populate the warehouse happens in a user- friendly page in the Admin Web UI:

The real benefits of having this common data warehouse become apparent when you want to write traceability reports, described in the next section.
Custom reporting with Rational Reporting for Development Intelligence
Rational Reporting for Development Intelligence (RRDI) provides a web-based authoring and report management portal that you can use to make the most of the data in the warehouse.
Because RRDI has access to the common data warehouse, you can write product-level CCM reports, or traceability reports that span the linked artifacts from the CCM, QM and RM domains in a way that helps you understand your development process.
RRDI is a separate install, which you can find in the “Optional Downloads” section of the RTC downloads page. RRDI is based on Cognos Technology.
Integration of RRDI reports in the RTC Web UI
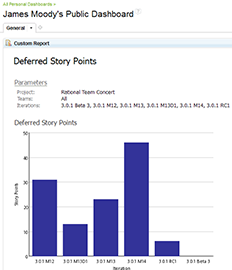
Writing reports in the RRDI tool is great, but you want to view those reports in the web UI, close to your other artifacts, where you are doing your development work. We provide integration in the Reports Web UI, as well as in the dashboard, that lets you do just that. Here’s what an RRDI report looks like in the Reports Web UI:

And here’s a dashboard version of that same report:
Dashboards
One of the biggest challenges for development team members is staying up to date with each other. The Rational solution for Collaborative Lifecycle Management provides a rich dashboard solution, with mashup support for team and personal use.
Rich Widget Catalog
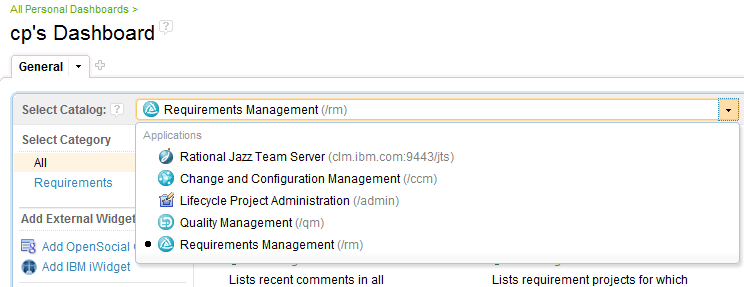
Add viewlets from any of the applications in a lifecycle project.You have access to the full catalog of widgets available for any dashboard. The catalog is discovered for each lifecycle project based on the associated applications. For example, a lifecycle project that associates an RM and CCM application will have access to the widget catalogs provided by the RM and CCM applications. A second lifecycle project that associates all three applications, will have access to the widget catalogs provided by all three applications as shown below.
In addition IBM iwidget and Open Social widgets are supported.
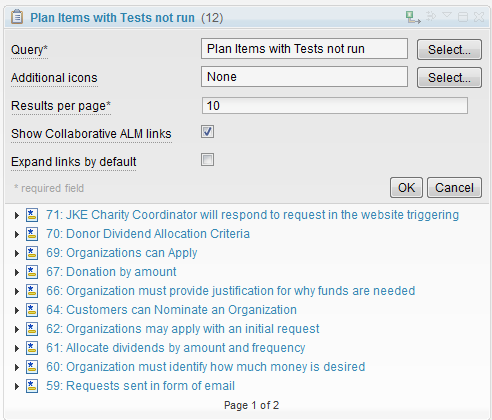
Dashboards also support widgets that run lifecycle queries. This means all users across the team can benefit from the provided lifecycle queries. A simple example applies to testers. Testers can now host a widget with a lifecycle query that identifies all “requirements with tests not run” – this helps the tester or test manager quickly assess which tests to run.
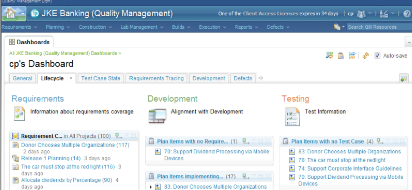
Example Analyst Mashup Dashboard
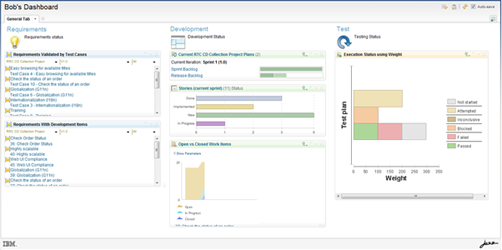
Analysts often wonder about the status of their requirements. Are they implemented, are they tested, what defects exist. Now instead of wondering, requirements analysts can create their own mashups to gain insight into the other teams status.
The image below shows a mashup of requirements, development, and test information.
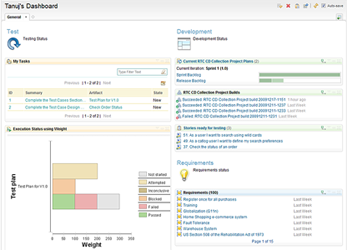
Example Developer Mashup Dashboard
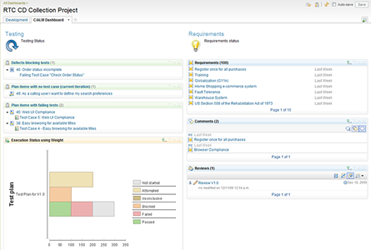
Developers can keep in touch with the requirements and test efforts by creating a mashup. In the image below, a developer has added a tab to organize the information coming from the other teams.
Tester Mashup Dashboard in Rational Quality Manager
Since test cases are written from requirements, and test execution (and defect verification) occurs after builds are delivered, testers need to stay on top of the action. By building a mashup, testers can stay in touch without having to leave Quality Manager. Staying in touch is as simple as reviewing your dashboard
Personal Dashboards
Personal Dashboards
Users can now create personalized dashboards. A personal dashboard is accessible to the user regardless of which application they are currently using. When navigating from one application to another, the personal dashboard is always accessible to the currently logged in user. All of your personal dashboards can be directly accessed via the Home Menu from any CLM application that shares the same Jazz Team Server (JTS).
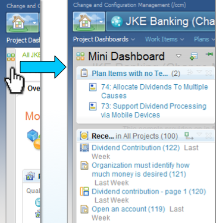
Mini Dashboard
Mini Dashboard
A mini dashboard is a miniature version of a personal dashboard, that is always accessible in the user interface. The Mini Dashboard is a new sidebar added to the Web UI that contains a single-column dashboard. It’s user configurable content remains consistent as you navigate between different Web UI contexts.
The mini dashboard is always docked on the left or right side of the user interface in a collapsed view. Simply clicking on the widget expands the mini dashboard. Configure the mini dashboard and your most meaningful information is only a click away.