
Progress Bars, Load Bars, and the importance of estimating your work in Rational Team Concert 2.0
The Agile Planning tooling assists you in planning and executing development iterations. The core of this support are Progress and Load Bars. This article describes the benefits of working with load and progress, their difference, and how to read the corresponding bars.
Load versus Progress
When following agile development methods, teams usually divide their work into fixed-length development iterations that have start and end dates. Hence, for every developer one can determine how much work time remains and how much work is still to do until the end a development iteration. In the Agile Planning tooling, this information is computed from the estimated time to work on remaining work items and your working time during a development week.
- Load Information is a comparison of remaining work time (as defined in the work environment) and remaining estimated work. You can think of this as ‘Do I have enough time to finish all my work in this iteration?‘ The (work-) load information should be used during bug triage since it provides a quick and easy way to figure out if a team member is overbooked or not.
- Progress Information does not only take remaining work into account, but finished work as well. It shows the ratio of closed versus open work items. Read a progress bar like this: ‘Considering all my work for this iteration. Where am I now?‘ If the past and the remaining work time is known, progress information can also provide a projection. It will compare the ratio of closed versus open work with the ratio of past versus remaining work time. The projection assumes that you will work on future work with the same velocity as you have worked on past work. So if the past work time is 9 hours and you completed work estimated 3 hours, the projection assumes that you need three times as much work time as estimated for the remaining work. This value is compared to the remaining work time. If it is smaller, you are ahead, if it is larger, you are behind your target.
| Load Bars | |
 | A load showing that 18 of 104 working hours are booked. The label and the white part of the bar indicate that there are 86 work hours which are not assigned yet to any work item. |
 | The work exceeds the remaining work time: 137 hours of work compared to 104 hours work time. The user is overbooked by 33 hours, as shown by the label and by the partially red bar. |
| Progress Bars | |
 | A progress bar showing that 48 out of 219 hours of work is completed. No projection is shown. |
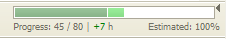 | Progress bar with projection. It shows that 45 out of 80 hours of work are completed that you completed more work than expected, considering the current iteration. The bright green part of the bar shows that you are ahead of your target. |
 | Being behind by 5 hours. The bar shows that 4 out of 21 work hours are completed. The completion of 9 work hours is expected and therefore the bar is painted partially red. |
Note: The load and progress bars are always indicative with respect to the amount of estimated work. Therefore, it is important to estimate your work to get an accurate picture of your load and progress. The degree to which your work is estimated is called Quality of Planning and is discussed later in this article.
Why accumulating Estimates and not counting Work Items?
In order to define the notion of work, the sum of all work item estimates is used instead of the bare number of work items. This has the following advantages:
- Estimates allow being more precise. Consider a complex feature and a simple bug fix. While both count as one work item, the feature might take 2 days while fixing the bug takes 2 hours. Assume progress computation would be based on work item counts and you already completed the feature. The progress will tell you that you achieved half or your targeted work, estimating the bug fix equally work intense as the complex feature.
- Estimates are flexible. While working on a work item, you may find out that you need more or less work than originally estimated. Simply correct the estimate and all load and progress bars will be updated.
What is Quality of Planning?
In the previous section we have seen that work is the accumulated estimate of a number of work items (closed or open). Estimating a work item is not mandatory and therefore the percentage of estimated work items has an impact on the accumulated estimate. The more work items you estimate the more precise the work can be computed. In Rational Team Concert, this is called the Quality of Planning. The quality is excellent if all work items are estimated, it is good if the majority is estimated, and so on. Visually, the percentage of estimated work items is represented as a fill-level. The height of load and progress bars shows how many work items have an estimate. If no work item is estimated, the bar is not visible, if all work items are estimated, the bar is fully visible.
 | A good percentage of work items is estimated. The bar is filled up almost to the top; the label shows the exact number (83%). |
 | 20% of the work items are estimated. This makes the statement of the bar likely to be wrong and, hence, it is filled up a little only. It is very likely that when the remaining 80% of the work items are estimated that the user will be overbooked. |  | A progress bar where 50% work items are estimated. Again, the bar is not filled up to the top. |
Progress Bars in Release Plans
The nature of release plans is to capture high-level work. Instead of focusing on execution items as iteration plans do, release plans focus on plan items. Plan Items are usually not estimated using work time; it is too difficult to be accurate as plan items are fussy. Therefore an abstract estimate is used, for example story points. This allows comparing the complexity of plan items but doesn’t require you to make a sound statement about wall-clock time, as this is sometimes simply not possible.
Progress bars honor this by calculating the progress of plan items based on their complexity rather than their estimate. By default, complexity is expressed as story points, but can be customized as needed, see Planning Customization for more details.
The bar in the image below shows the progress of a release plan.
Apart from the labels and tool tip, the rendering is the same. The only difference is that story points rather than hours are used to report progress. Read it like this: in total there are 11 story points and 7 are already done.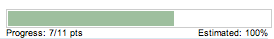
Progress bars in release plans are also capable of projecting a plan's progress. For instance, if an iteration is half over already – say 30 of 40 work hours – but only a third of your story points are done – for example 10 of 30 points – the plan is behind, as three quarter of the work time is over compared to only one third of the story points done.
Where is the next Bar?
Load and progress bars can be found at several places. The Plan editor shows an overall progress in its header and load or progress on the grouping elements of the Planned Items page. Furthermore, there is the Team Load section which is a Team Central section. Given a team area and an iteration, it will show the load of each team member. Load is also shown in the Current Work section of the My Work view. It will show the load information for the currently logged in user.